
📊 Elliott Wave Technical Analysis – EUR/USD (1H, New Week)
🔹 Wave Structure
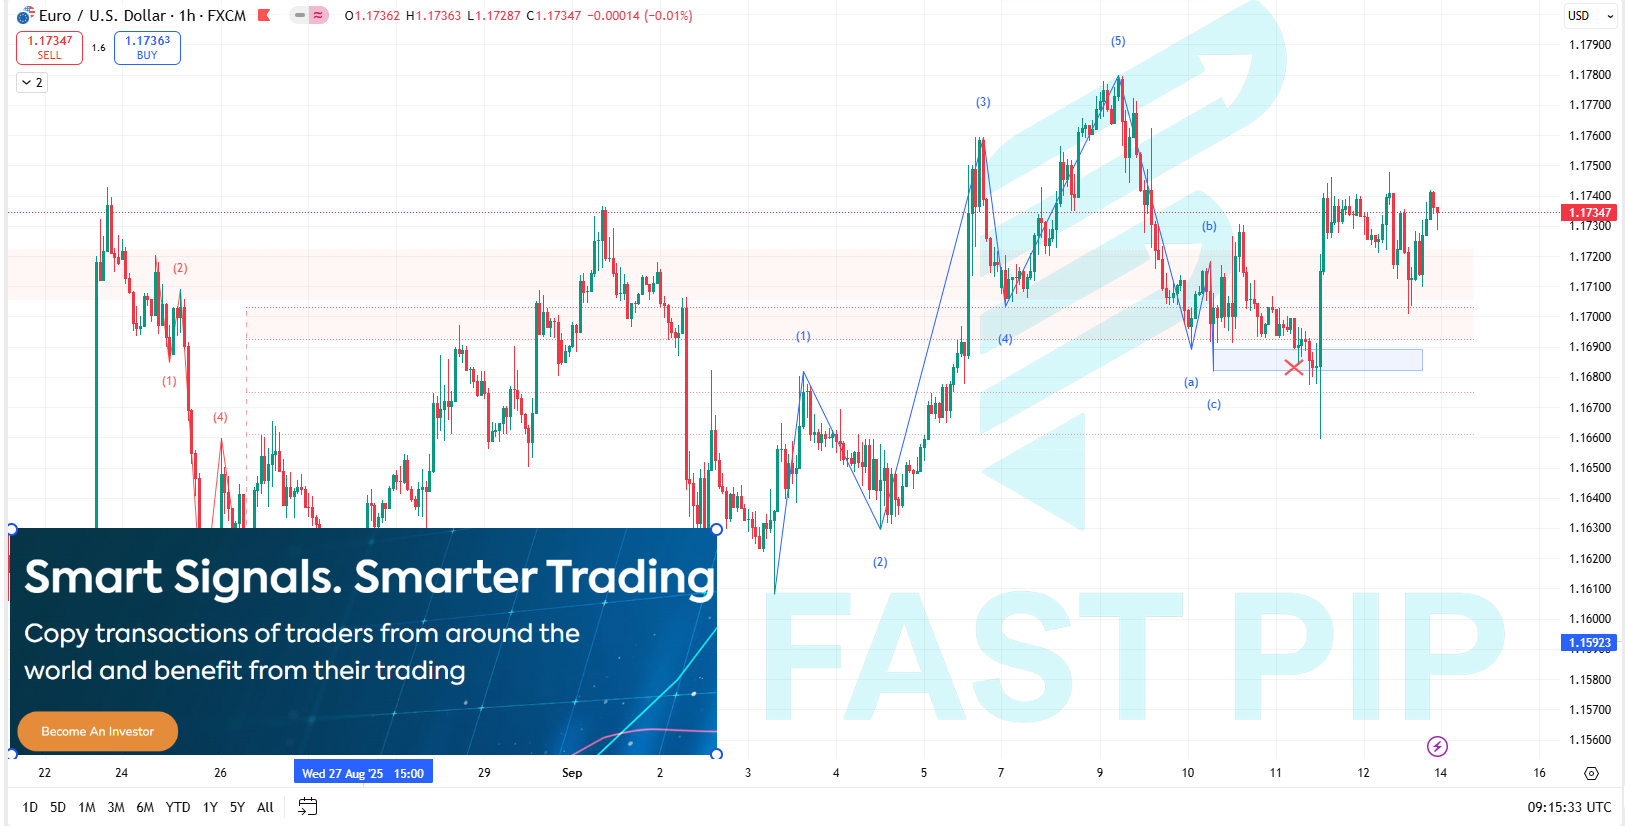
- After a sharp decline at the end of August, EUR/USD formed a complete five-wave impulsive move downward.
- From the early days of September, the pair developed a bullish five-wave sequence, peaking around 1.1780.
- A corrective pattern (a–b–c) followed, pushing price down toward the 1.1690–1.1680 demand zone.
- Buyers stepped in strongly from that support, and price is now consolidating around 1.1730.
🔹 Current Situation
- Support zone: 1.1690–1.1680
- Immediate resistance: 1.1765
- Major resistance: 1.1780–1.1800
🔹 Main Scenario (Bullish – Preferred)
- Entry (Buy): Above 1.1725–1.1730
- Stop Loss (SL): Below 1.1680
- Targets (TP):
- TP1: 1.1765
- TP2: 1.1785–1.1800
- TP3: 1.1850 if momentum continues
🔹 Alternative Scenario (Bearish – Less Likely)
- If price breaks below 1.1680, the bullish count will be invalidated.
- In that case, expect a deeper retracement toward 1.1640 and potentially 1.1600.
🔹 Signal Summary
📈 Preferred: Buy above 1.1730 with SL below 1.1680, targets at 1.1765, 1.1785, and 1.1850.
📉 Alternative: Sell only if price closes below 1.1680, aiming for 1.1640–1.1600.
⚠️ Disclaimer: This is a technical outlook based on Elliott Wave methodology. Market movements can shift quickly due to fundamental news (ECB policy, US inflation, interest rate decisions). Always apply risk management and use protective stop-losses.
 More from FastPip
 Read More on Our Blog:
Discover in-depth articles on trading strategies, Elliott Wave, and market insights on our FastPip Blog.
Check Our Signals:
Follow real-time trading setups and performance on the FastPip Signals page