
NZD/USD Intraday Forecast: Sellers Remain in Control Below 0.5748 Resistance
Introduction
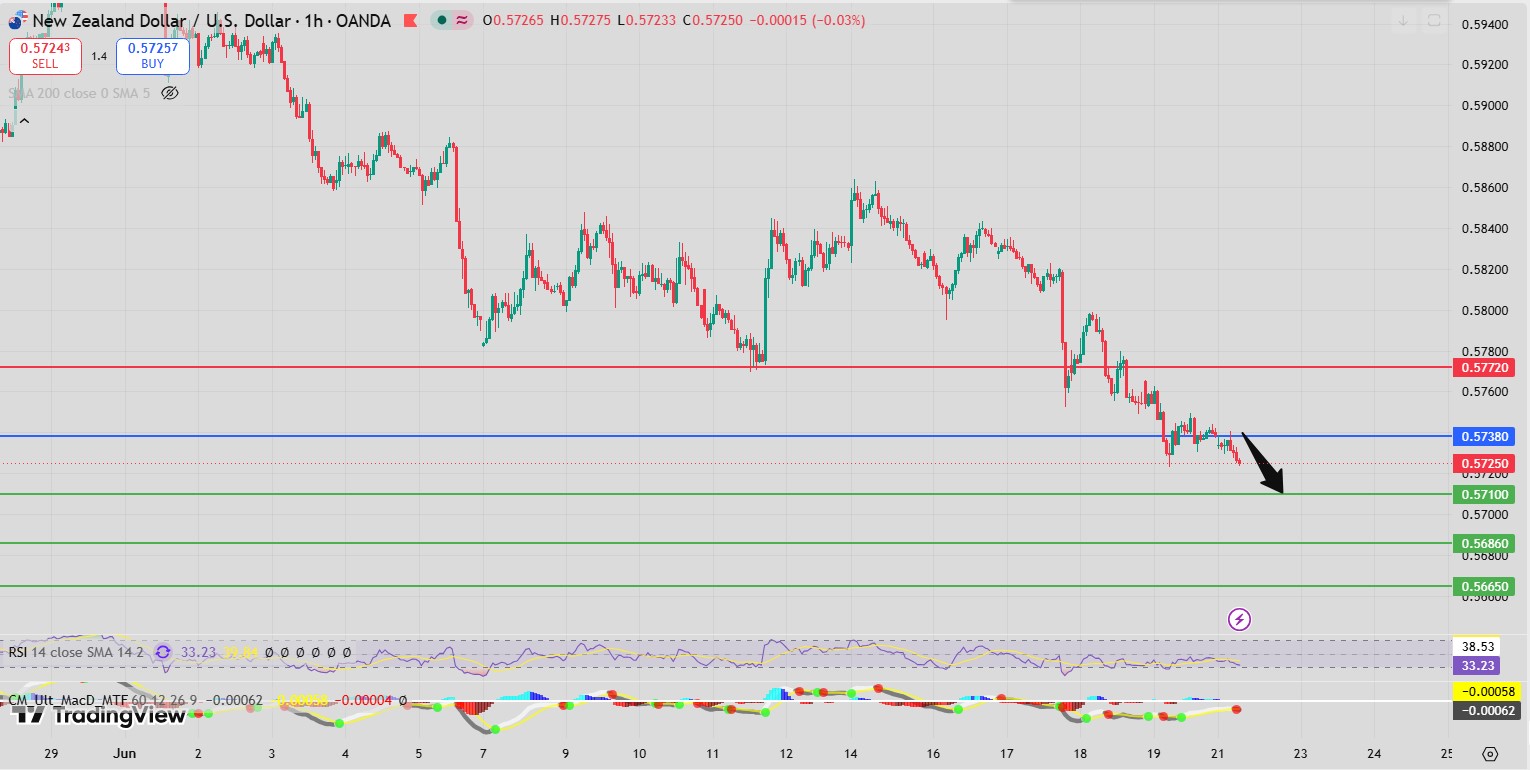
The NZD/USD Intraday Forecast remains negative as the currency pair continues to trade below the critical resistance level at 0.5748. Weak momentum indicators and bearish price action suggest that sellers remain firmly in control of the short-term trend.
For additional forex market insights and daily analysis, visit:
https://fastpip.com/category/forex-analysis/
The latest NZD/USD Intraday Forecast highlights increasing downside risks as the pair struggles to recover above key resistance zones.
NZD/USD Intraday Forecast Technical Analysis
The NZD/USD Intraday Forecast reflects a bearish technical structure supported by several negative indicators.
The Relative Strength Index (RSI) remains below its neutrality area at 50, indicating weak momentum and persistent selling pressure. At the same time, the MACD remains below its signal line and in negative territory, confirming that bearish momentum continues to dominate.
Price action also reinforces the negative outlook. The pair remains below its 20-period moving average at 0.5735 and its 50-period moving average at 0.5737, showing that both short-term and medium-term trends remain under pressure.
For monetary policy updates and economic developments affecting currency markets, traders can follow:
https://www.federalreserve.gov/
As long as resistance remains intact, technical conditions continue to support additional downside movement.
Market Sentiment Analysis
The NZD/USD Intraday Forecast reflects cautious sentiment toward the New Zealand dollar as traders assess global growth expectations, commodity demand, and monetary policy developments.
The New Zealand dollar often performs well when risk appetite is strong, but current market conditions continue to favor defensive positioning and US dollar strength.
For global economic outlook reports and forecasts, traders can review:
Current sentiment remains weak and continues to support the bearish scenario.
NZD/USD Intraday Forecast Support and Resistance Levels
Support and resistance analysis remains central to the current market structure.
The key resistance level is located at 0.5748, which serves as the primary pivot separating bullish and bearish scenarios.
As long as NZD/USD remains below this level, sellers are expected to maintain control.
The primary downside target is 0.5686, which represents the next significant support objective in the current NZD/USD Intraday Forecast.
Under the alternative scenario, a breakout above resistance could expose 0.5770 and 0.5783.
NZD/USD Intraday Forecast Trading Scenario Analysis
According to the NZD/USD Intraday Forecast, short positions remain favored while the pair trades below 0.5748.
The combination of a weak RSI, negative MACD configuration, and price trading below key moving averages strengthens the bearish outlook.
If current conditions persist, sellers may continue pushing the market toward the 0.5686 objective.
The inability of buyers to reclaim resistance further reinforces the downside scenario and increases the probability of trend continuation.
Risk Factors and Alternative Outlook
Despite the bearish outlook in the NZD/USD Intraday Forecast, traders should remain aware of potential volatility caused by economic releases, central bank commentary, and changes in global risk sentiment.
A sustained move above 0.5748 would invalidate the preferred bearish scenario and shift attention toward upside targets at 0.5770 and 0.5783.
Maintaining disciplined risk management remains essential under all market conditions.
Conclusion
The NZD/USD Intraday Forecast remains bearish below the key resistance level at 0.5748. Weak RSI readings, negative MACD signals, and price action below important moving averages continue to support downside expectations.
As long as resistance remains intact, the focus remains on the 0.5686 downside target.
FAQ
What is the current NZD/USD Intraday Forecast?
The forecast remains bearish below 0.5748 with a downside target at 0.5686.
Why is 0.5748 important?
It acts as the key resistance and pivot level separating bullish and bearish scenarios.
What does the RSI indicate?
The RSI remains below 50, signaling weak momentum and bearish market conditions.
What does the MACD show?
The MACD remains below its signal line and in negative territory, supporting further downside.
What could invalidate the bearish outlook?
A sustained break above 0.5748 would shift attention toward 0.5770 and 0.5783.