
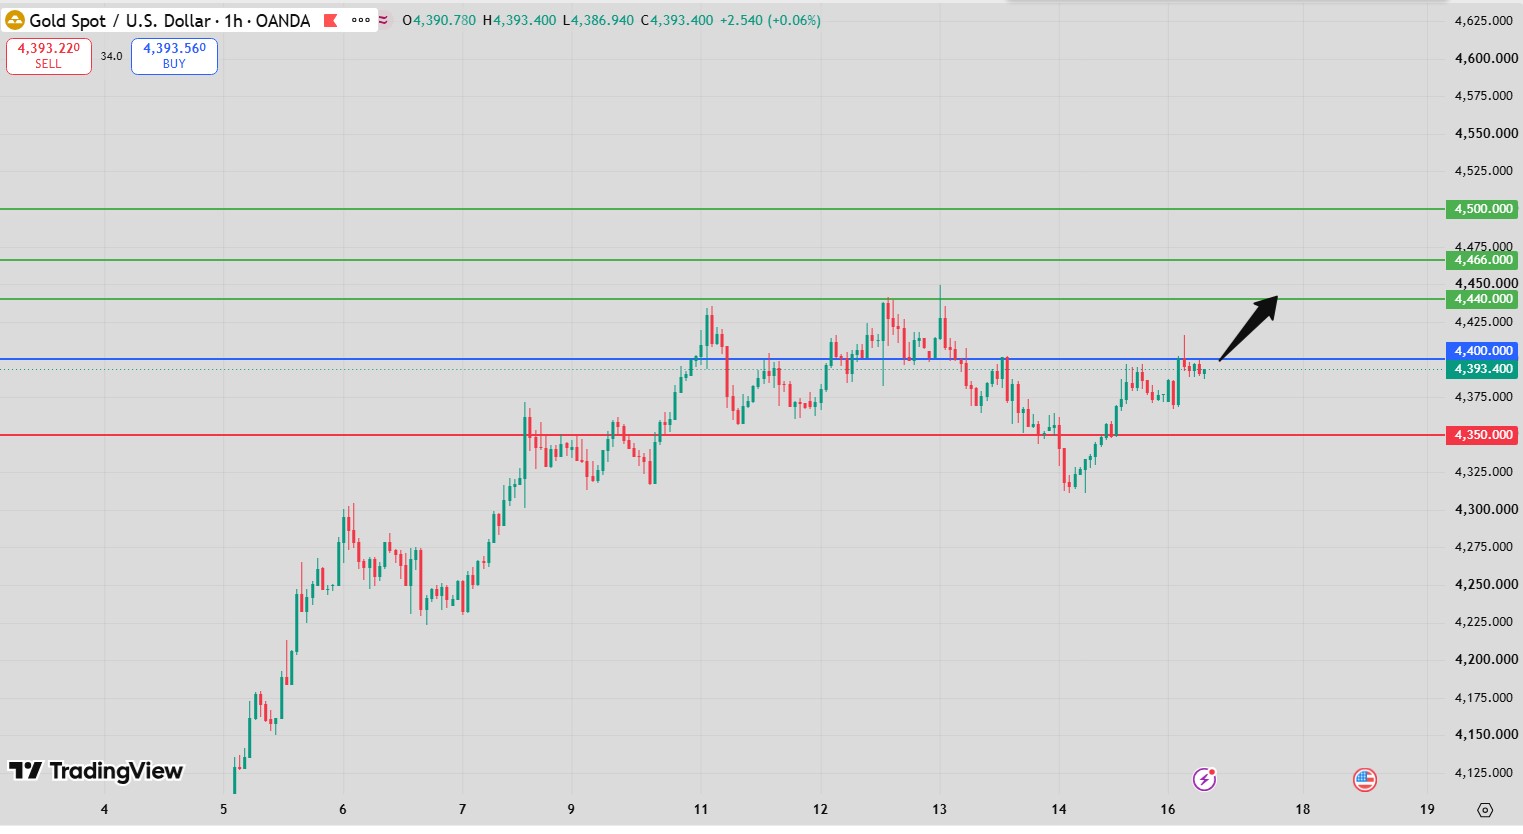
Gold Intraday Forecast: Upside Toward 4,444 and 4,466 While 4,360 Holds
Introduction
The Gold Intraday Forecast remains bullish as long as gold holds above the key pivot level at 4,360. The current technical structure favors further upside, with 4,444 as the primary target and 4,466 as the second upside objective.
Several technical indicators continue to support the bullish scenario. The RSI is above its neutral level of 50, while gold is trading above both its 20-period and 50-period moving averages. However, the MACD is below its signal line despite remaining positive, indicating that short-term momentum has weakened somewhat.
This combination suggests that the broader trend remains constructive, although traders should be prepared for periods of consolidation or profit-taking before the next potential upside extension.
Gold Intraday Forecast Technical Analysis
The Gold Intraday Forecast maintains a positive structure above 4,360.
The most important technical reference is the pivot at 4,360. As long as price remains above this level, buyers retain control of the short-term structure.
Gold is currently positioned above:
- 20-period moving average: 4,386
- 50-period moving average: 4,369
The fact that price remains above both moving averages reinforces the bullish trend.
The RSI is also above 50, confirming that the balance of momentum remains favorable to buyers.
However, the MACD presents a more cautious signal. Although it remains positive, it is below its signal line. This indicates that the broader bullish structure is still intact, but the acceleration of short-term momentum may be limited.
Gold Intraday Forecast Market Sentiment Analysis
The Gold Intraday Forecast remains supported by a constructive market environment, although gold continues to face the possibility of short-term volatility around important technical levels.
Gold can react strongly to changes in:
- US dollar strength.
- Treasury yields.
- Federal Reserve expectations.
- Inflation data.
- Global risk sentiment.
- Geopolitical developments.
- Safe-haven demand.
The current technical configuration suggests that buyers remain active above the 4,360 pivot.
At the same time, the positive-but-weaker MACD configuration means traders should not assume that the market will move toward 4,444 and 4,466 in a straight line.
A temporary consolidation could occur before the next directional move.
Gold Intraday Forecast Support and Resistance Levels
The key levels in today’s Gold Intraday Forecast are clearly defined.
Key Pivot Support: 4,360
The most important support level is:
4,360
As long as gold remains above this level, the bullish scenario remains valid.
20-Period Moving Average: 4,386
The short-term moving average is positioned at:
4,386
This level provides additional technical support above the main pivot.
50-Period Moving Average: 4,369
The 50-period moving average stands at:
4,369
Its proximity to the 4,360 pivot creates a relatively important support zone.
First Target: 4,444
The primary upside target is:
4,444
A successful move toward this level would confirm continued buying pressure.
Second Target: 4,466
If buyers maintain control beyond the first target, gold could extend toward:
4,466
Alternative Downside Scenario
A sustained break below 4,360 would weaken the bullish setup.
The alternative targets are:
- 4,324
- 4,303
Gold Intraday Forecast Trading Scenario Analysis
According to the Gold Intraday Forecast, the preferred scenario remains bullish above 4,360.
The primary path is:
Above 4,360 → 4,444 → 4,466
The setup is supported by the RSI remaining above 50 and price holding above both major moving averages.
If gold moves through 4,444 with strong buying pressure, the next objective becomes 4,466.
However, the MACD being below its signal line means that traders should remain alert to a potential pause or correction.
A temporary pullback that remains above 4,360 would not necessarily invalidate the bullish trend.
The bearish scenario becomes more important only after a decisive break below the pivot.
In that situation, the market could move toward 4,324, followed by 4,303.
Gold Intraday Forecast Risk Factors and Alternative Outlook
The main technical risk to the Gold Intraday Forecast is a failure to hold 4,360.
A breakdown below this level would indicate that sellers are gaining control and could trigger a deeper corrective move.
Other risks include:
- A sharp recovery in the US dollar.
- Rising Treasury yields.
- Hawkish changes in Federal Reserve expectations.
- Stronger-than-expected US economic data.
- Profit-taking near the upside targets.
- Sudden changes in geopolitical risk.
The MACD configuration is another reason for caution. Although the indicator remains positive, its position below the signal line shows that short-term momentum is not as strong as the broader price structure.
Therefore, 4,360 remains the key level for maintaining the bullish bias.
Gold Intraday Forecast Conclusion
The Gold Intraday Forecast remains bullish while gold holds above 4,360.
The current structure is supported by the RSI remaining above 50 and price trading above both the 20-period moving average at 4,386 and the 50-period moving average at 4,369.
The primary target is 4,444, followed by 4,466 if bullish momentum continues.
The main caution comes from the MACD, which remains positive but is below its signal line. This suggests that short-term momentum may experience periods of consolidation even while the broader trend remains positive.
A decisive break below 4,360 would invalidate the preferred upside scenario and expose the market to 4,324 and 4,303.
For now, buyers retain the advantage above the pivot.
FAQ
What is the current Gold Intraday Forecast?
The forecast remains bullish above 4,360, with targets at 4,444 and 4,466.
Why is 4,360 important?
It is the key pivot support separating the bullish and bearish scenarios.
What are the main upside targets?
The first target is 4,444, followed by 4,466.
What does the RSI indicate?
The RSI is above 50, indicating that bullish momentum remains dominant.
Is the MACD fully bullish?
The MACD remains positive but is below its signal line. This suggests that the broader structure is constructive while short-term momentum has weakened somewhat.
What happens if gold breaks below 4,360?
The bullish setup would weaken, with potential downside targets at 4,324 and 4,303.

