
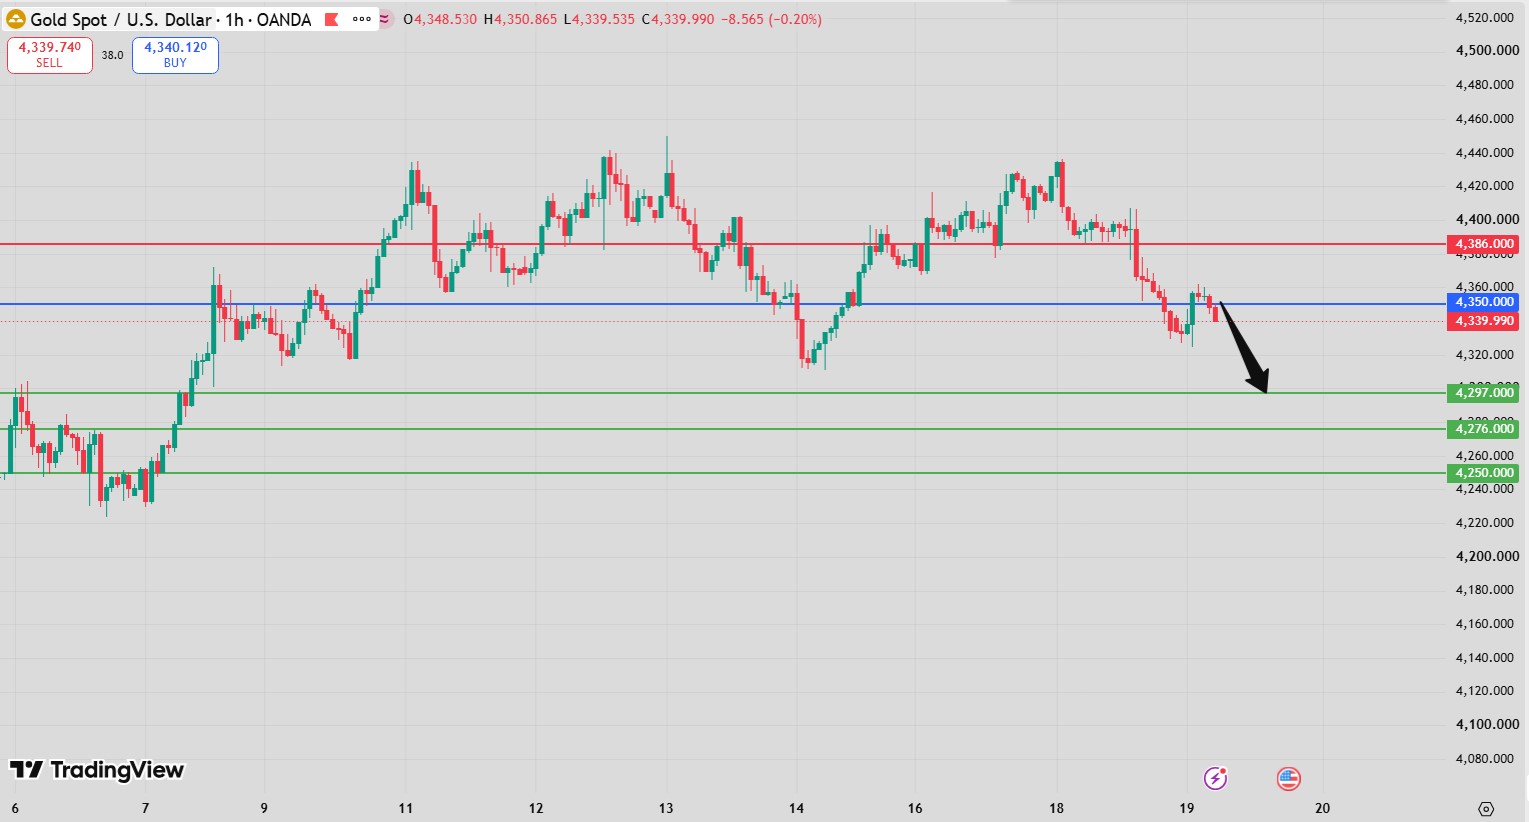
Gold Intraday Forecast: Downside Toward 4,297 and 4,276 While 4,386 Holds as Resistance
Introduction
The Gold Intraday Forecast has shifted to a bearish intraday structure as long as 4,386 continues to act as resistance. The current technical setup favors a decline toward 4,297 as the first target, followed by 4,276 if selling pressure continues.
The key technical level for the session is therefore 4,386. As long as gold remains below this pivot, sellers maintain the short-term advantage and the downside scenario remains preferred.
Technical momentum also supports caution on the bullish side. The RSI is below its neutrality area at 50, while the MACD remains negative despite trading above its signal line. Meanwhile, price is positioned above the 20-period moving average but below the 50-period moving average, reflecting a mixed but vulnerable short-term structure.
A sustained break above 4,386, however, would weaken the bearish scenario and shift attention toward 4,421 and 4,442.
Gold Intraday Forecast Technical Analysis
The Gold Intraday Forecast favors the downside while 4,386 remains resistance.
The preferred technical path is:
Below 4,386 → 4,297 → 4,276
The first target at 4,297 represents the initial downside objective. If sellers manage to maintain control and push gold below this level, the next target becomes 4,276.
The RSI remains below the neutral 50 area, indicating that bearish momentum continues to influence the short-term structure. The MACD is negative, although it remains above its signal line, suggesting that downside pressure exists but may not yet be accelerating strongly.
Price positioning around the moving averages also deserves attention. Gold is above the 20-period moving average at approximately 4,344, but remains below the 50-period moving average around 4,368. This creates a mixed technical configuration, with the 50-period average acting as an additional reference for the broader intraday structure.
Gold Intraday Forecast Market Sentiment Analysis
The Gold Intraday Forecast currently reflects cautious sentiment, with the technical structure favoring sellers below 4,386.
Gold remains sensitive to movements in the US dollar, Treasury yields, Federal Reserve expectations and broader market risk sentiment. Changes in these factors can quickly influence demand for the precious metal.
Important drivers include:
- US dollar strength.
- Federal Reserve policy expectations.
- Treasury yields.
- Inflation expectations.
- Global economic data.
- Geopolitical developments.
- Safe-haven demand.
- Investor positioning.
The current RSI and MACD configuration suggests that buyers have not yet regained sufficient momentum to challenge the key resistance at 4,386 decisively.
As long as that level remains intact, the bearish intraday scenario continues to have the stronger technical foundation.
Gold Intraday Forecast Support and Resistance Levels
The key levels in today’s Gold Intraday Forecast are clearly defined.
Key Pivot Resistance: 4,386
The most important level for the current setup is:
4,386
As long as gold remains below this level, the downside scenario remains preferred.
First Target: 4,297
The primary downside objective is:
4,297
A move toward this level would confirm continued selling pressure below the pivot.
Second Target: 4,276
If sellers maintain control below 4,297, the next objective becomes:
4,276
This represents the second downside target in the current setup.
Alternative Upside Target: 4,421
A sustained break above 4,386 would invalidate the preferred bearish scenario and expose:
4,421
Second Alternative Target: 4,442
Further upside momentum could then push gold toward:
4,442
Gold Intraday Forecast Trading Scenario Analysis
According to the Gold Intraday Forecast, the preferred scenario remains bearish while 4,386 acts as resistance.
Bearish Scenario
The primary scenario is:
Below 4,386 → 4,297 → 4,276
As long as gold fails to break above the pivot, sellers can continue targeting the lower levels.
A break below 4,297 would strengthen the downside structure and increase the probability of a move toward 4,276.
Consolidation Scenario
Gold could temporarily consolidate between its current price and the 4,386 resistance level.
Such consolidation would not automatically invalidate the bearish structure. The critical factor remains whether buyers can achieve a sustained breakout above 4,386.
Bullish Alternative Scenario
The alternative scenario becomes active above 4,386.
If buyers establish a decisive break above this resistance, gold could move toward 4,421, followed by 4,442.
This would indicate that the current bearish pressure is losing strength and that buyers are attempting to regain control.
Gold Intraday Forecast Risk Factors and Alternative Outlook
The primary risk to the Gold Intraday Forecast is a decisive breakout above 4,386.
The current technical indicators are not uniformly bearish. While the RSI remains below 50 and the MACD is negative, the MACD is above its signal line and price remains above the 20-period moving average. This means that a bullish reversal cannot be completely ignored.
Important risk factors include:
- Sudden weakness in the US dollar.
- Falling Treasury yields.
- Changes in Federal Reserve expectations.
- Strong safe-haven demand.
- Unexpected economic data.
- Geopolitical developments.
- A breakout above 4,386.
The most important technical confirmation for the bearish outlook remains gold’s inability to overcome 4,386.
Gold Intraday Forecast Conclusion
The Gold Intraday Forecast remains bearish while 4,386 holds as resistance, with 4,297 as the first target and 4,276 as the second downside objective.
The RSI remains below its neutral area at 50, while the MACD is negative, supporting the current downside bias. However, the price position relative to the moving averages indicates that the technical structure is not completely one-sided.
The key level remains 4,386. As long as this resistance holds, the preferred path remains toward 4,297 and 4,276.
Conversely, a decisive break above 4,386 would shift the outlook toward 4,421 and 4,442.
FAQ
What is the current Gold Intraday Forecast?
The Gold Intraday Forecast remains bearish below 4,386, with targets at 4,297 and 4,276.
Why is 4,386 important?
It is the key pivot and resistance level. Holding below it keeps the bearish scenario active.
What are the downside targets for gold?
The first target is 4,297, followed by 4,276.
What happens if gold breaks above 4,386?
The alternative scenario points toward 4,421 and 4,442.
What do the RSI and MACD indicate?
The RSI is below 50, indicating bearish momentum, while the MACD remains negative but is above its signal line, suggesting that downside pressure is present but the momentum structure is not completely one-directional.

