
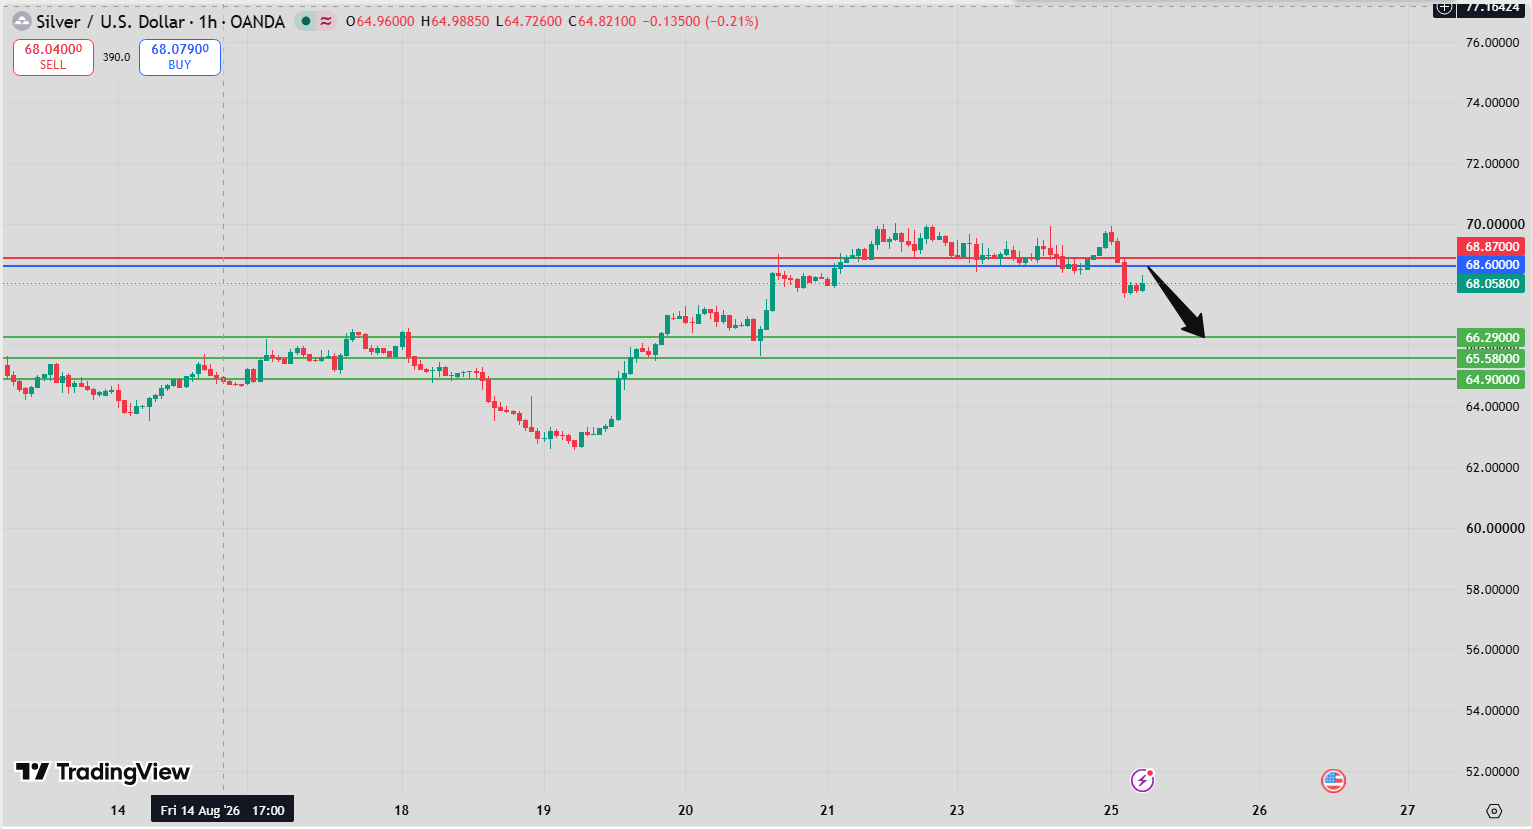
Silver Intraday Forecast: Downside Toward 66.29 and 65.58 While 68.87 Holds
Introduction
The Silver Intraday Forecast remains bearish as long as 68.87 continues to act as resistance. The current technical structure favors further downside, with 66.29 as the first target and 65.58 as the second downside objective.
The short-term technical indicators are currently aligned with the bearish scenario. The RSI is below its neutrality area at 50, indicating that downside momentum remains dominant. At the same time, the MACD is below its signal line and negative, providing additional confirmation of the current bearish structure.
Price is also trading below both the 20-period and 50-period moving averages, located around 68.74 and 68.85, respectively. This positioning indicates that sellers currently have control of the short-term trend.
The key technical level remains 68.87. As long as silver remains below this resistance, the path toward 66.29 and potentially 65.58 remains open.
Silver Intraday Forecast Technical Analysis
The Silver Intraday Forecast favors the downside while 68.87 remains resistance.
The preferred technical path is:
Below 68.87 → 66.29 → 65.58
The first target at 66.29 represents the primary downside objective. If sellers maintain control and silver breaks below this level, the decline could extend toward 65.58.
The RSI remains below 50, showing that bearish momentum continues to dominate the short-term structure.
The MACD is also below its signal line and negative, reinforcing the downside bias.
Another important factor is the position of price relative to the moving averages. Silver is trading below the 20-period moving average at approximately 68.74 and below the 50-period moving average near 68.85.
As long as price remains below these moving averages and particularly below 68.87, the bearish scenario remains preferred.
Silver Intraday Forecast Market Sentiment Analysis
The Silver Intraday Forecast currently reflects negative short-term market sentiment, with sellers maintaining control below 68.87.
Silver is influenced by movements in the US dollar, interest-rate expectations, precious-metal demand and industrial-market conditions.
Important market drivers include:
- US dollar movements.
- Federal Reserve policy expectations.
- Treasury yields.
- Inflation expectations.
- Industrial demand.
- Global economic growth.
- Precious-metal sentiment.
- Investor positioning.
- Broader risk sentiment.
The current technical structure favors sellers. The RSI remains below 50, the MACD is negative and price is below both key moving averages.
However, silver can experience significant intraday volatility. A sudden change in the US dollar or interest-rate expectations could quickly alter the short-term momentum.
For now, the market remains under pressure while 68.87 acts as resistance.
Silver Intraday Forecast Support and Resistance Levels
The key levels in today’s Silver Intraday Forecast are clearly defined.
Key Pivot Resistance: 68.87
The main technical resistance is:
68.87
As long as silver remains below this level, the bearish scenario remains valid.
First Target: 66.29
The primary downside objective is:
66.29
A move toward this level would confirm continued selling pressure.
Second Target: 65.58
If sellers successfully break below the first target, the next objective becomes:
65.58
Alternative Upside Level: 70.06
A sustained break above 68.87 would weaken the bearish setup and expose:
70.06
Second Alternative Target: 70.77
Further bullish momentum could then lead toward:
70.77
Silver Intraday Forecast Trading Scenario Analysis
According to the Silver Intraday Forecast, the preferred scenario remains bearish below 68.87.
Bearish Continuation Scenario
The primary path is:
Below 68.87 → 66.29 → 65.58
As long as 68.87 acts as resistance, sellers retain control of the short-term structure.
A decline toward 66.29 would represent the first downside objective. If silver breaks below this level with sustained selling pressure, the next target would be 65.58.
Pullback Scenario
Silver could experience a temporary rebound before continuing lower.
A recovery toward the 68.74–68.87 area would bring price back toward the moving averages and key resistance.
If buyers fail to overcome 68.87, such a rebound would remain consistent with the broader bearish scenario and could be followed by renewed selling pressure.
Bearish Continuation After Rebound
A temporary recovery does not necessarily invalidate the bearish structure.
If silver rebounds toward resistance but fails to break above 68.87, sellers could regain control and push the market back toward 66.29 and 65.58.
Bullish Alternative Scenario
The alternative scenario becomes active above 68.87.
A decisive break and sustained move above the pivot would weaken the bearish setup and shift attention toward 70.06.
If buyers maintain momentum beyond that level, the next objective would become 70.77.
Silver Intraday Forecast Risk Factors and Alternative Outlook
The main risk to the Silver Intraday Forecast is a sustained break above 68.87.
Although the current indicators favor sellers, silver is a highly volatile asset and can react rapidly to changes in macroeconomic expectations.
Important risk factors include:
- Sudden US dollar weakness.
- Falling Treasury yields.
- Changes in Federal Reserve expectations.
- Strong precious-metal demand.
- Changes in industrial demand expectations.
- Unexpected economic data.
- Shifts in investor positioning.
- Short covering after the recent decline.
The most important technical warning for the bearish scenario would be a decisive move above 68.87.
Until that occurs, the downside remains the preferred direction.
Silver Intraday Forecast Conclusion
The Silver Intraday Forecast remains bearish below 68.87, with 66.29 as the first target and 65.58 as the second downside objective.
The technical structure currently favors sellers. The RSI is below its neutrality area at 50, while the MACD is below its signal line and negative. Price is also trading below both the 20-period and 50-period moving averages at approximately 68.74 and 68.85.
These signals collectively support the continuation of the short-term downside structure.
The key resistance remains 68.87. As long as this level holds, silver can continue to move toward 66.29 and potentially 65.58.
Conversely, a sustained break above 68.87 would invalidate the preferred bearish scenario and expose 70.06 and 70.77.
Overall, the technical balance favors sellers, with 68.87 serving as the critical level separating the bearish and bullish scenarios.
FAQ
What is the current Silver Intraday Forecast?
The Silver Intraday Forecast remains bearish below 68.87, with targets at 66.29 and 65.58.
Why is 68.87 important?
It is the key pivot resistance. Holding below this level keeps the bearish scenario active.
What are the downside targets for silver?
The first target is 66.29, followed by 65.58.
What do the RSI and MACD indicate?
The RSI is below 50, while the MACD is below its signal line and negative. Both indicators support the current bearish momentum.
What happens above 68.87?
A sustained break above the pivot would weaken the bearish structure and could lead toward 70.06 and 70.77.
Where are the moving averages?
Silver is trading below its 20-period moving average around 68.74 and its 50-period moving average near 68.85, reinforcing the short-term bearish bias.

