
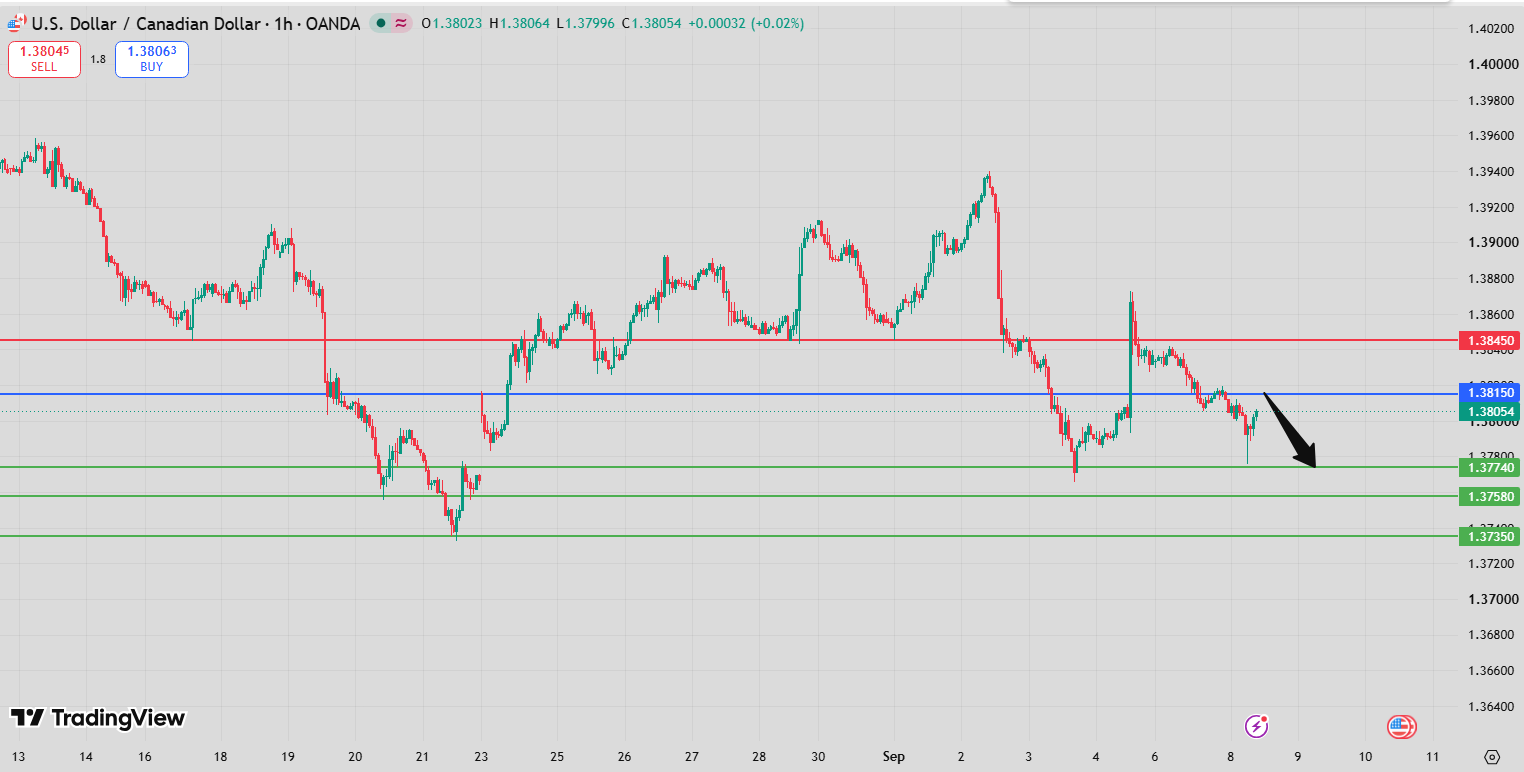
USD/CAD Intraday Forecast: Downside Toward 1.3774 and 1.3758 While 1.3834 Holds
Introduction
The USD/CAD Intraday Forecast remains focused on downside risks as long as the key resistance at 1.3834 limits upward movement. The pair is currently positioned between important moving averages, while momentum indicators provide a mixed but still cautious backdrop for the short-term outlook.
The primary bearish scenario points toward 1.3774 as the first target, followed by 1.3758 if selling pressure accelerates. However, traders should closely monitor the reaction around 1.3834, as a decisive break above this level would weaken the bearish setup and shift attention toward higher resistance levels.
USD/CAD Intraday Forecast Technical Analysis
From a technical perspective, USD/CAD is showing signs of short-term weakness below the 1.3834 pivot resistance. The RSI remains below its neutral 50 level, indicating that bearish momentum still has an advantage despite the absence of deeply oversold conditions.
The MACD is above its signal line but remains in negative territory. This creates a mixed momentum picture: the recent downside pressure is not fully confirmed by the MACD crossover, but the indicator’s position below zero suggests that the broader short-term momentum remains vulnerable.
Price is trading above the 20-period moving average at 1.3802, which provides nearby dynamic support. However, the pair remains below the 50-period moving average at 1.3810, leaving the broader short-term structure under pressure.
As long as price remains below 1.3834, sellers retain control of the primary intraday scenario.
USD/CAD Intraday Forecast Market Sentiment Analysis
Market sentiment around USD/CAD is cautiously bearish. The RSI below 50 indicates that buyers have not been able to establish strong momentum, while the position below the 50-period moving average reinforces the possibility of renewed selling pressure.
At the same time, the price trading above the 20-period moving average suggests that the pair has some short-term support underneath. This means the bearish scenario may not develop through an immediate straight-line decline. Instead, USD/CAD could experience temporary rebounds before sellers attempt to push the price toward the projected targets.
The key factor remains the reaction around 1.3834. Failure to break this resistance would keep the bearish sentiment intact.
USD/CAD Intraday Forecast Support and Resistance Levels
Key Pivot Resistance: 1.3834
The 1.3834 level is the central resistance for the current intraday outlook. Remaining below this level keeps the downside scenario active.
First Downside Target: 1.3774
The first bearish objective is 1.3774. A move toward this level would confirm continued selling pressure below the pivot.
Second Downside Target: 1.3758
If sellers break through 1.3774 with sufficient momentum, the next downside objective becomes 1.3758.
Alternative Upside Target: 1.3861
A sustained break above 1.3834 would invalidate the immediate bearish structure and expose 1.3861 as the first upside objective.
Second Alternative Upside Target: 1.3877
Further bullish continuation above 1.3861 could extend the recovery toward 1.3877.
Key Levels Summary
- Pivot Resistance: 1.3834
- Target A: 1.3774
- Target B: 1.3758
- Alternative Target A: 1.3861
- Alternative Target B: 1.3877
USD/CAD Intraday Forecast Trading Scenario Analysis
Bearish Scenario
The preferred scenario remains bearish while 1.3834 acts as resistance. A failure to break this level could encourage sellers to target 1.3774, followed by 1.3758.
A decisive break below the first target would strengthen the downside structure and indicate that bearish momentum is expanding.
Pullback Scenario
USD/CAD may temporarily recover toward the 1.3810–1.3834 area before sellers return. The 50-period moving average around 1.3810 and the main pivot at 1.3834 should therefore be monitored closely during any intraday rebound.
A rejection from this zone would favor another move lower.
Bullish Alternative Scenario
The bearish outlook would weaken if USD/CAD establishes a sustained move above 1.3834. In that case, buyers could target 1.3861, with 1.3877 becoming the next upside objective.
USD/CAD Intraday Forecast Risk Factors and Alternative Outlook
The main risk to the bearish forecast is a decisive breakout above 1.3834. Such a move would indicate that buyers have regained control and could trigger a stronger recovery toward the alternative targets.
Another risk comes from the mixed technical signals. Although RSI is below 50 and price remains below the 50-period moving average, the MACD is above its signal line and price is holding above the 20-period moving average. This combination means that downside momentum should be monitored rather than assumed.
For bears, maintaining pressure below 1.3834 remains essential. For bulls, reclaiming and holding above this level is the key requirement for a change in the intraday outlook.
USD/CAD Intraday Forecast Conclusion
The USD/CAD Intraday Forecast remains bearish while 1.3834 acts as resistance. The immediate downside objectives are 1.3774 and 1.3758, with RSI below 50 supporting the cautious bearish bias.
However, the technical picture is not completely one-sided because the MACD remains above its signal line and price is still above the 20-period moving average. A sustained break above 1.3834 would therefore change the outlook and expose 1.3861 and 1.3877.
For now, the reaction around 1.3834 remains the most important factor for determining the next intraday move.
FAQ
Is USD/CAD bearish below 1.3834?
Yes. The primary intraday outlook remains bearish while 1.3834 acts as resistance.
What is the first USD/CAD downside target?
The first downside target is 1.3774.
What is the second downside target?
If selling pressure continues below 1.3774, the next target is 1.3758.
What happens if USD/CAD breaks above 1.3834?
A sustained break above 1.3834 would invalidate the immediate bearish scenario and could open the way toward 1.3861 and 1.3877.
What do the RSI and MACD indicate?
The RSI below 50 favors bearish momentum, while the MACD being above its signal line but still negative creates a mixed short-term momentum picture.

