
USD/CAD Intraday Forecast: Downside Toward 1.3737 and 1.3721 While 1.3801 Holds
Introduction
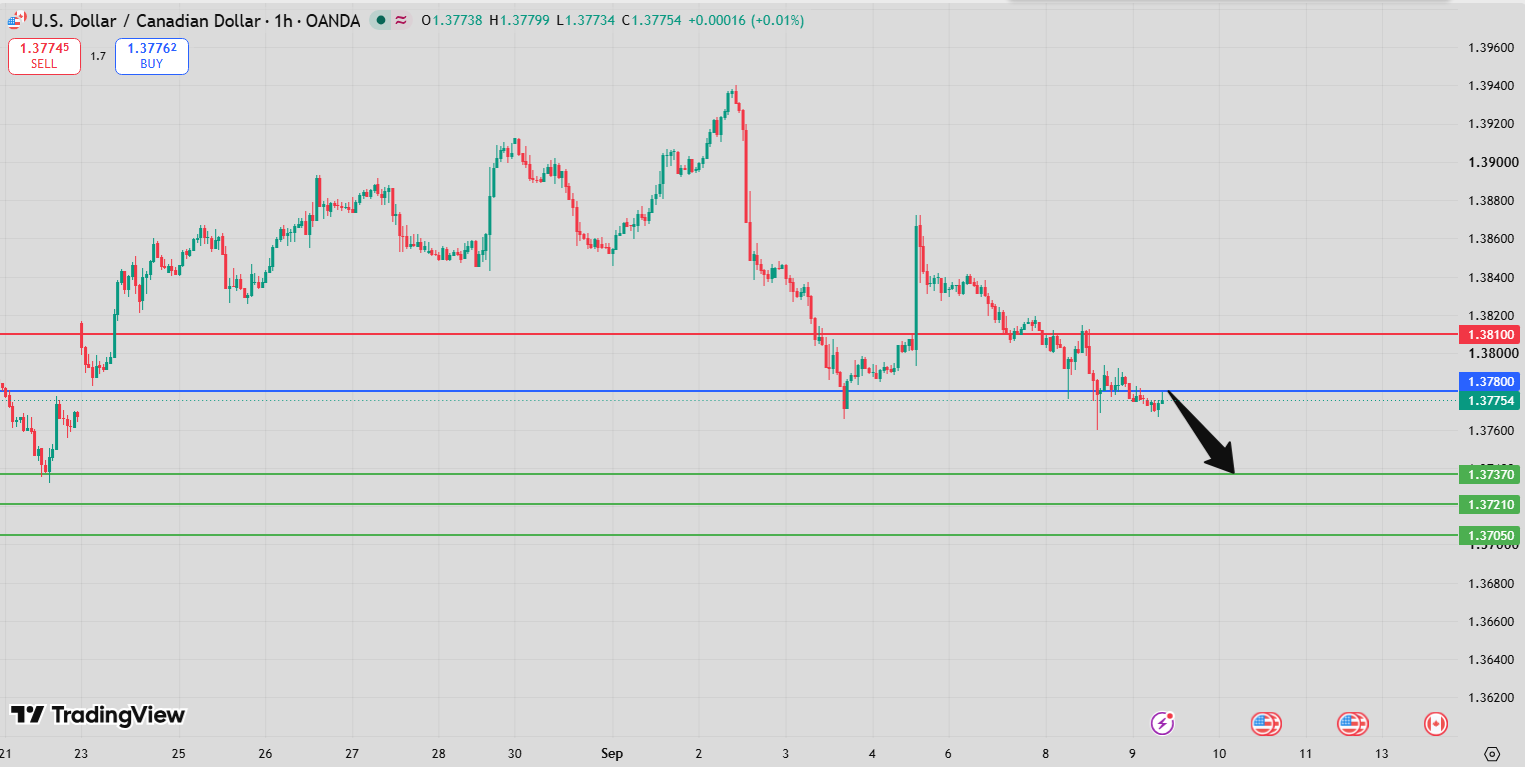
The USD/CAD Intraday Forecast remains bearish as long as 1.3801 acts as resistance. The preferred scenario targets 1.3737 as the first downside objective, followed by 1.3721 if selling pressure continues.
The technical structure favors sellers, with the RSI below its neutral 50 level, the MACD below its signal line and negative, and price trading below both the 20-period and 50-period moving averages. These signals reinforce the current downside bias.
USD/CAD Intraday Forecast Technical Analysis
The primary technical path is:
Below 1.3801 → 1.3737 → 1.3721
USD/CAD is trading below its 20-period moving average at 1.3777 and its 50-period moving average at 1.3785. This positioning indicates that sellers currently maintain control of the short-term structure.
The RSI remains below 50, signaling weak momentum, while the MACD is below its signal line and remains negative. The combination of these indicators supports the continuation of the bearish scenario.
As long as price remains below 1.3801, the downside remains the preferred direction.
USD/CAD Intraday Forecast Market Sentiment Analysis
Market sentiment remains bearish for USD/CAD. The RSI below 50 and negative MACD indicate that buying momentum is limited, while price below both moving averages reinforces the weak short-term structure.
The immediate focus is on whether sellers can drive the pair toward 1.3737. A break below this level could extend the decline toward 1.3721.
A sustained recovery above 1.3801 would be required to significantly weaken the current bearish sentiment.
USD/CAD Intraday Forecast Support and Resistance Levels
Key Pivot Resistance: 1.3801
1.3801 is the key resistance level controlling the current intraday outlook.
First Downside Target: 1.3737
The first bearish objective is 1.3737.
Second Downside Target: 1.3721
If sellers break below 1.3737, the next target becomes 1.3721.
Alternative Upside Target: 1.3828
A sustained move above 1.3801 would invalidate the immediate bearish structure and expose 1.3828.
Second Alternative Upside Target: 1.3845
Further bullish continuation could extend the recovery toward 1.3845.
Key Levels Summary
- Pivot / Resistance: 1.3801
- Target A: 1.3737
- Target B: 1.3721
- Alternative Target A: 1.3828
- Alternative Target B: 1.3845
USD/CAD Intraday Forecast Trading Scenario Analysis
Bearish Scenario
Below 1.3801, the preferred path remains toward 1.3737, followed by 1.3721. The negative MACD and RSI below 50 support the downside scenario.
Pullback Scenario
A temporary rebound toward the 1.3777–1.3801 region is possible. The 20-period and 50-period moving averages around 1.3777 and 1.3785 may provide resistance during a recovery.
A rejection from this area would favor renewed selling pressure.
Bullish Alternative Scenario
A decisive break above 1.3801 would weaken the bearish outlook and could open the way toward 1.3828 and 1.3845.
USD/CAD Intraday Forecast Risk Factors and Alternative Outlook
The main risk to the bearish scenario is a sustained breakout above 1.3801. Such a move would signal that buyers are regaining control and could trigger a stronger recovery.
For now, however, the RSI, MACD and moving-average structure remain aligned with the downside scenario. Traders should closely monitor the reaction around the 1.3801 pivot.
USD/CAD Intraday Forecast Conclusion
The USD/CAD Intraday Forecast remains bearish below 1.3801, with 1.3737 and 1.3721 as the main downside targets.
The RSI below 50, negative MACD and price below both the 20-period and 50-period moving averages reinforce the bearish structure. A break above 1.3801 would shift attention toward 1.3828 and 1.3845.
FAQ
What is the current USD/CAD Intraday Forecast?
The outlook remains bearish below 1.3801, with targets at 1.3737 and 1.3721.
What is the first downside target?
The first target is 1.3737.
What is the second downside target?
The second target is 1.3721.
What happens if USD/CAD breaks above 1.3801?
A sustained breakout could open the way toward 1.3828 and 1.3845.
What do the technical indicators show?
The RSI is below 50, the MACD is below its signal line and negative, and price is below both the 20-period and 50-period moving averages, supporting the bearish bias.

