
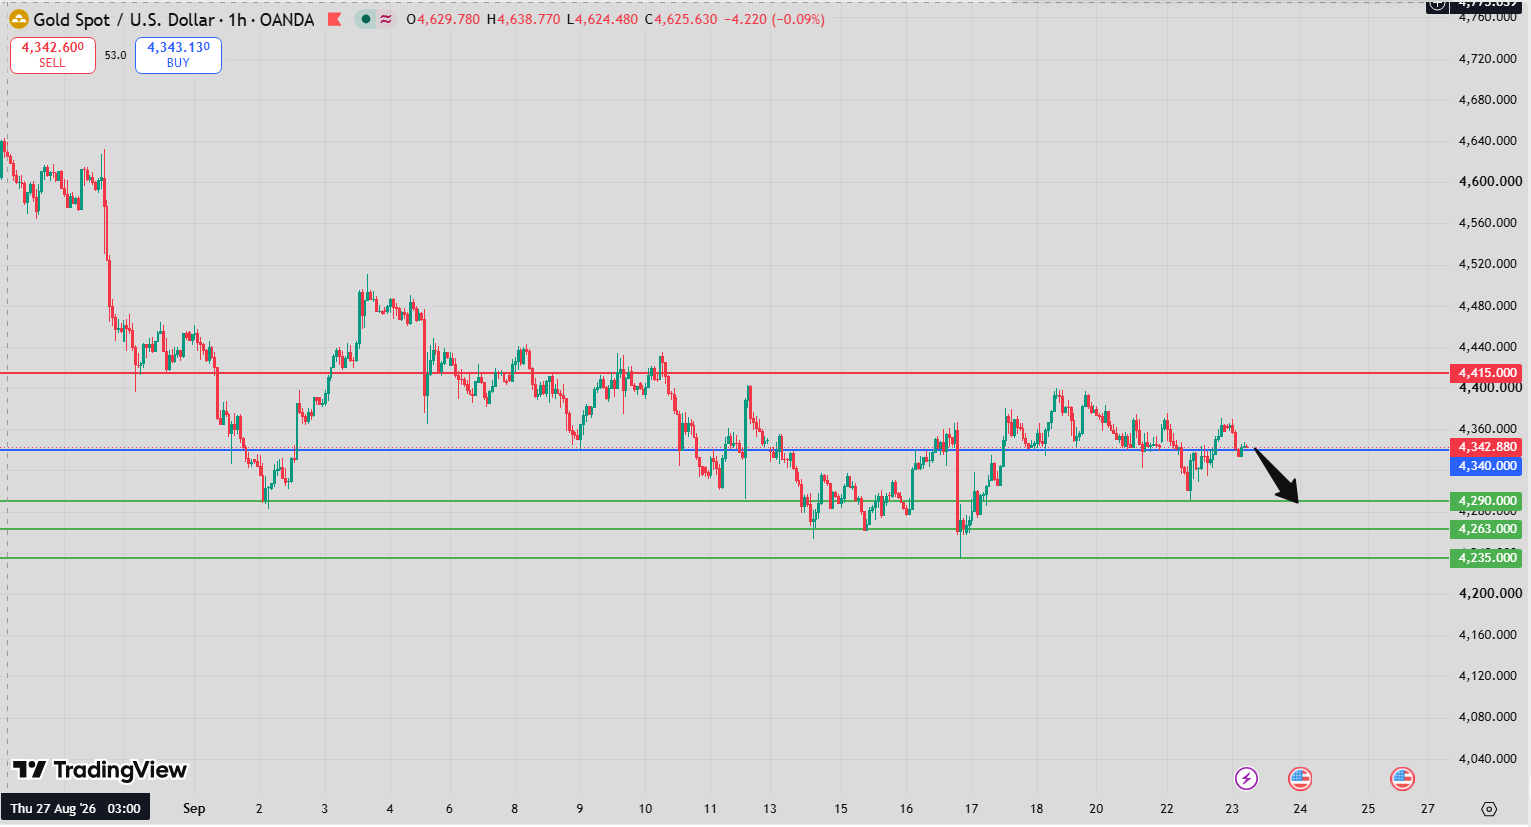
Gold Intraday Forecast: Downside Toward 4,290 and 4,263 While 4,391 Holds
Introduction
The latest Gold Intraday Forecast points to continued downside pressure as long as 4,391 remains a key resistance level. Gold is currently trading below its 20-period moving average, while momentum indicators continue to favor sellers.
The primary downside targets are located at 4,290 and 4,263. These levels become increasingly important if gold remains below the 4,391 pivot and selling pressure continues to dominate the intraday structure.
At the same time, the position of price relative to the 50-period moving average requires attention. Gold remains above the 50-period average near 4,339, meaning that this level could provide temporary support during a decline.
Gold Intraday Forecast Technical Analysis
The current technical structure remains bearish, with 4,391 acting as the main resistance and pivot level. As long as price remains below this threshold, the downside scenario remains active.
Momentum indicators reinforce this view. The RSI is below its neutral 50 level, indicating that bullish momentum remains limited. The MACD is also below its signal line and remains negative, providing additional evidence of bearish momentum.
Gold is trading below the 20-period moving average at approximately 4,353. This indicates that short-term price momentum remains under pressure. However, price is still above the 50-period moving average around 4,339, creating an important technical support area between the current price structure and deeper downside targets.
A break below this medium-term average could strengthen the bearish structure and increase the probability of a move toward 4,290.
Gold Intraday Forecast Market Sentiment Analysis
Market sentiment remains cautious as gold continues to trade below its main pivot resistance at 4,391. The combination of RSI below 50 and a negative MACD suggests that sellers currently have greater momentum in the short-term structure.
The moving averages provide a more mixed element to the analysis. Gold remains below the 20-period average, which favors near-term weakness, but it is still above the 50-period average. This means that the 4,339 region could become an important battleground if selling pressure intensifies.
A successful defense of this support area could produce a temporary rebound. However, unless gold can reclaim 4,391, such a rebound would not by itself invalidate the broader bearish setup.
Gold Intraday Forecast Support and Resistance Levels
Key Pivot Resistance: 4,391
The 4,391 level is the most important resistance and pivot in the current Gold Intraday Forecast.
As long as gold remains below this level, the bearish scenario remains active. A sustained break above 4,391 would weaken the downside structure and shift attention toward the alternative upside targets.
First Downside Target: 4,290
The first major bearish objective is 4,290. This is the primary target highlighted by the current signal.
A move toward 4,290 would indicate that sellers have successfully extended the downside momentum from the resistance area.
Second Downside Target: 4,263
If bearish momentum continues after 4,290 is reached and broken, the next target becomes 4,263.
This level represents the second major downside objective and could become an area where buyers attempt to stabilize the market.
Alternative Upside Levels
If gold breaks above 4,391 and establishes a sustained move higher, the alternative scenario points toward:
- 4,437 as the first upside objective
- 4,464 as the second upside objective
These levels become relevant if the main resistance at 4,391 is decisively overcome.
Gold Intraday Forecast Trading Scenario Analysis
Bearish Scenario
The primary scenario remains bearish while 4,391 acts as resistance. Continued weakness would keep 4,290 as the first target, followed by 4,263 if selling pressure accelerates.
The bearish structure is supported by RSI below 50, MACD below its signal line and in negative territory, and price trading below the 20-period moving average.
The 50-period moving average near 4,339 is an important intermediate level. A decisive break below it could provide additional confirmation of downside continuation.
Pullback Scenario
Gold could experience a temporary rebound if buyers defend the 50-period moving average around 4,339. Such a recovery could push price back toward the 20-period moving average near 4,353.
However, a short-term rebound would not necessarily change the broader setup. The key level remains 4,391. Unless buyers reclaim and sustain price above this resistance, the bearish scenario remains technically relevant.
Bullish Alternative Scenario
A sustained break above 4,391 would challenge the current bearish structure. In this case, attention would shift toward 4,437, followed by 4,464.
For the alternative bullish scenario to gain technical confirmation, price would need to overcome 4,391 while momentum indicators begin to recover from their current negative configuration.
Gold Intraday Forecast Risk Factors and Alternative Outlook
The main risk to the bearish Gold Intraday Forecast is a sustained recovery above 4,391. Such a move would invalidate the primary downside setup and expose the alternative upside levels.
Another factor is the 50-period moving average around 4,339. Because price remains above this average, buyers still have an important technical reference that could slow the decline.
A failure to break this support followed by a recovery toward 4,353 could create short-term volatility. Traders should therefore monitor whether price remains below the 20-period average or manages to reclaim it.
The RSI and MACD should also be monitored for changes in momentum. A recovery in both indicators, combined with a break above 4,391, would significantly weaken the current bearish structure.
Gold Intraday Forecast Conclusion
The current Gold Intraday Forecast remains bearish while 4,391 holds as resistance. The primary downside objectives are 4,290 and 4,263, with RSI below 50 and a negative MACD supporting the bearish momentum.
Gold is below its 20-period moving average at 4,353 but remains above its 50-period average near 4,339. This makes the 4,339 area an important intermediate support during the expected downside move.
If sellers break this support, the path toward 4,290 and potentially 4,263 becomes more relevant. Conversely, a sustained break above 4,391 would invalidate the bearish scenario and shift attention toward 4,437 and 4,464.
FAQ
What is the current Gold Intraday Forecast?
The current forecast remains bearish while gold stays below the 4,391 resistance level, with 4,290 and 4,263 as the primary downside targets.
What is the first target for gold?
The first downside target is 4,290.
What is the second target for gold?
The second downside target is 4,263, which becomes relevant if sellers extend the decline below the first target.
What level invalidates the bearish gold scenario?
A sustained break above 4,391 would invalidate the primary bearish scenario and shift attention toward 4,437 and 4,464.
What do the moving averages indicate?
Gold is below the 20-period moving average at approximately 4,353, which supports short-term weakness. However, price remains above the 50-period moving average near 4,339, making that area an important intermediate support.

