
Dow Jones Intraday Forecast: Key Support Zone Under Pressure
Introduction
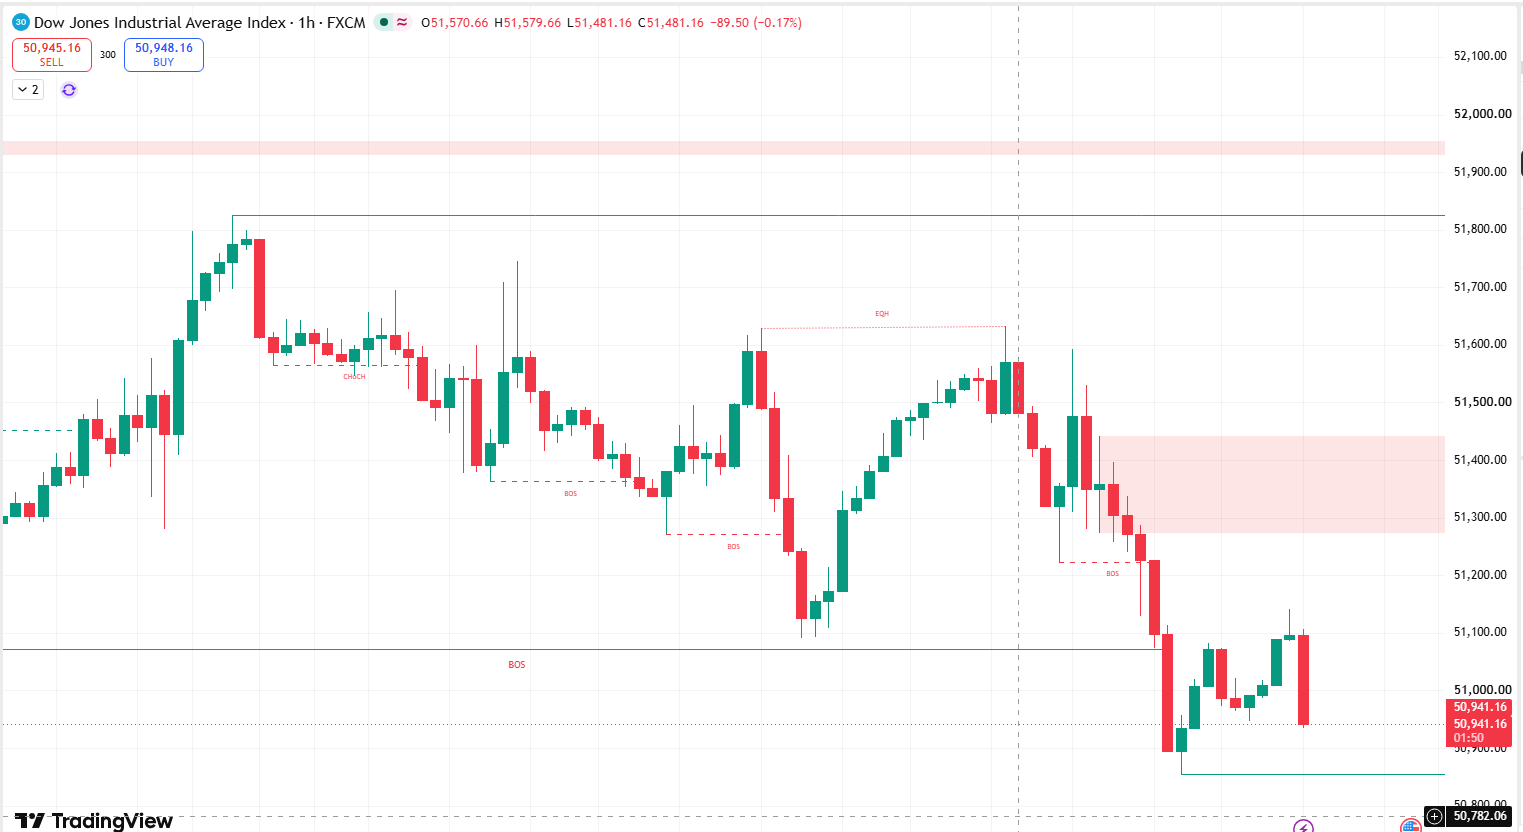
The latest Dow Jones Intraday Forecast remains bearish as the index continues to trade below the important 51,070 structural level. The 1-hour chart shows a clear sequence of lower highs and lower lows, while several bearish Break of Structure (BOS) signals confirm that sellers have gained control of the short-term market structure.
After failing to sustain the recovery toward the 51,500–51,600 area, price turned lower and broke through the 51,200 region before extending the decline toward the current 50,940 area.
The market is now approaching the lower support zone around 50,850, making this level particularly important for determining whether the bearish move continues or a temporary pullback develops.
Dow Jones Intraday Forecast Technical Analysis
The technical structure on the 1-hour chart is predominantly bearish. After reaching the 51,800 area, Dow Jones began forming lower highs and progressively weaker lows. The subsequent bearish BOS signals indicate that previous support structures were broken as sellers continued to expand their control.
The recovery from approximately 51,100 toward 51,550–51,600 failed to produce a new bullish structure. Instead, price was rejected from the upper area and subsequently broke below the 51,200 region.
The sharp decline through 51,070 is particularly significant. This level had previously acted as an important structural support, and its breakdown shifted the short-term order flow further toward the sellers.
The current price near 50,940 is approaching the lower demand/support area around 50,850. A decisive break below this zone would strengthen the bearish structure and could expose lower levels around 50,780 and potentially below.
Dow Jones Intraday Forecast Market Sentiment Analysis
Short-term sentiment remains bearish for Dow Jones. The repeated rejection from higher levels, combined with the sequence of lower highs and bearish BOS formations, suggests that rallies are currently being met with selling pressure.
The 51,280–51,440 area is especially important from a Smart Money perspective. This zone can act as a potential supply area where sellers may become active if price retraces upward.
A recovery into this zone without a structural bullish breakout would therefore represent a potential pullback rather than confirmation of a trend reversal.
At the same time, the current approach toward 50,850 creates a potential reaction area. Buyers may attempt to defend this zone, so the reaction around this level should be monitored carefully before assuming an immediate continuation of the decline.
Dow Jones Intraday Forecast Support and Resistance Levels
Key Pivot Resistance: 51,070
The 51,070 level is the primary structural resistance for the current bearish setup. Price has already broken below this area, making it an important threshold for any potential recovery.
As long as Dow Jones remains below 51,070, the short-term bearish structure remains dominant.
Supply Zone: 51,280–51,440
The 51,280–51,440 region represents the main overhead supply zone visible on the chart.
A retracement into this area could attract renewed selling pressure, particularly if price produces bearish rejection or fails to establish a higher high.
First Downside Target: 50,850
The first important downside level is around 50,850. This area corresponds with the recent low and the lower structural support visible on the chart.
A reaction from this level could generate a short-term corrective rebound.
Second Downside Target: 50,780
A sustained break below 50,850 could expose the next lower area around 50,780. This level is particularly relevant because it sits close to the lower boundary visible on the chart.
Major Resistance: 51,820
The broader resistance remains around 51,820, where the previous major high was formed. A sustained move back above this area would significantly change the current bearish structure.
Key Levels
- Structural Resistance: 51,070
- Supply Zone: 51,280–51,440
- Major Resistance: 51,820
- First Downside Target: 50,850
- Second Downside Target: 50,780
Dow Jones Intraday Forecast Trading Scenario Analysis
Bearish Scenario
The primary scenario remains bearish while 51,070 acts as resistance. Continued trading below this level keeps the recent bearish Break of Structure valid and leaves the market exposed to the 50,850 support zone.
If sellers successfully break below 50,850, downside momentum could extend toward 50,780. A decisive break of this lower level would indicate that sellers are continuing to expand the bearish structure.
Pullback Scenario
Because the index has already experienced a strong decline, a temporary recovery cannot be ruled out. Price could rebound from the 50,850 area and move back toward 51,070.
Such a recovery would initially be considered corrective as long as price remains below the main supply zone at 51,280–51,440.
A rejection from 51,070 or from the supply zone would provide evidence that sellers remain active.
Bullish Alternative Scenario
The bearish outlook would begin to weaken if Dow Jones reclaims 51,070 and subsequently establishes acceptance above the 51,280–51,440 supply zone.
A sustained breakout through this area could open the way toward 51,600 and eventually the major resistance around 51,820.
However, the chart currently does not show a confirmed bullish structural reversal, so the key confirmation would be the creation of higher highs and higher lows above the existing supply area.
Dow Jones Intraday Forecast Risk Factors and Alternative Outlook
The main risk to the bearish scenario is a strong reaction from the 50,850 support area. Since this region represents the latest downside extreme, buyers may attempt to use it to initiate a corrective recovery.
Another risk is a false breakdown below 50,850 followed by a rapid reclaim. Such price action could indicate that liquidity below the recent low has been taken before a short-term reversal.
For sellers, the most important invalidation area is the 51,280–51,440 supply zone. A sustained move above this region would weaken the current bearish structure and increase the possibility of a deeper recovery.
The distinction between a normal pullback and a genuine reversal will therefore depend on how price behaves around 51,070 and the 51,280–51,440 supply area.
Dow Jones Intraday Forecast Conclusion
The current Dow Jones Intraday Forecast remains bearish while price trades below 51,070. The 1-hour structure shows lower highs, lower lows and multiple bearish Break of Structure signals, confirming continued short-term selling pressure.
The first important downside level is 50,850, while a decisive break below this area could expose 50,780.
On the upside, 51,070 is the first critical structural level, followed by the 51,280–51,440 supply zone. A sustained breakout above this region would weaken the bearish structure and shift attention toward higher resistance levels.
For the current setup, 51,070 is the key structural resistance, while 50,850 is the main downside decision level.
FAQ
What is the current Dow Jones Intraday Forecast?
The current Dow Jones Intraday Forecast remains bearish while the index trades below 51,070.
What is the first downside target for Dow Jones?
The first major downside target is around 50,850, which represents the latest important support area.
What happens if Dow Jones breaks below 50,850?
A confirmed break below 50,850 could extend the bearish move toward approximately 50,780.
Where is the main supply zone?
The main supply zone is located around 51,280–51,440. A rejection from this area could support another bearish continuation.
What would weaken the bearish scenario?
A sustained recovery above 51,070, followed by a breakout through the 51,280–51,440 supply zone, would weaken the current bearish structure and create a stronger bullish alternative scenario.

