
Elliott Wave Trading: A Complete Practical Guide
In this Elliott Wave trading guide, you’ll spot 1–5 and A–B–C waves, use Fibonacci and channeling, set invalidation, and turn counts into trade-ready signals—Bias, Entry, SL, and TP1–TP3 with clear risk rules.
Introduction
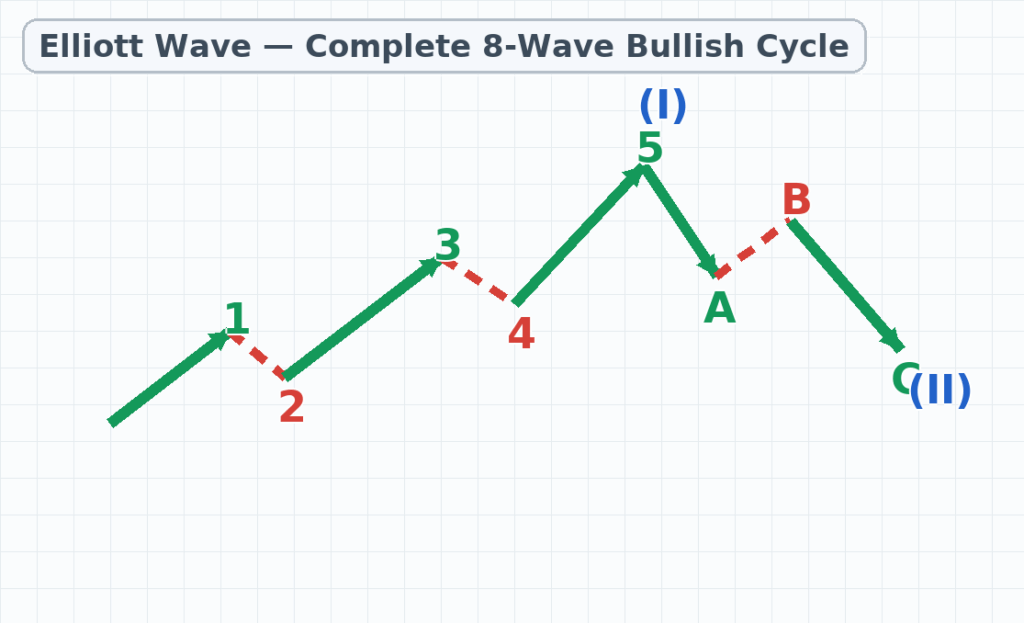
Elliott Wave Trading is a structured way to turn crowd behavior into actionable signals. Price action is grouped into impulsive waves (1–5) and corrective waves (A–B–C). The result is a clear roadmap for trend identification, Entry, Stop-Loss, and TP1–TP3 targets.
This guide uses plain language and short sentences. The goal is a practical framework for consistent, low-error signals.
Why does Elliott matter to traders? Because it gives you invalidation. When that level breaks, the idea is invalid and you exit. That’s real risk management—not guesswork. Multi-timeframe alignment, Fibonacci confluence, and channeling help refine entries and targets.
We’ll move step by step: the history and logic of the theory, common structures and hard rules, and then a standard signaling workflow: Bias, Entry, SL, TP1/TP2/TP3, confidence, and the alternate scenario. Examples show how a wave count becomes a real trade.
This text is SEO-friendly without keyword stuffing. If you trade volatile markets like Forex, this structure brings discipline. With Elliott, decisions are rule-based, not emotion-based. Next, you’ll learn the rules, Fibonacci proportions, and a practical checklist that turns today’s count into a trade-ready setup.
We also publish live trading signals based on this Elliott framework. View them for free here:
FastPip Elliott Wave Signals
History of Elliott Wave Theory

Origins (1930s).
Ralph Nelson Elliott, an accountant recovering from illness, studied decades of market data. He noticed recurring patterns in trends and pullbacks. In 1938 he published “The Wave Principle,” and in 1946 “Nature’s Law – The Secret of the Universe.” His core idea: markets move in 5-wave impulses and 3-wave corrections in a fractal hierarchy.
Influences.
Elliott was inspired by Dow Theory (trend, correction, primary cycles) and by proportional relationships that later traders mapped with Fibonacci tools. He stressed rules (what must not be broken) and guidelines (what often occurs).
Dormant to revival (1970s–1980s).
The work gained fresh attention when A. J. Frost and Robert Prechter published “Elliott Wave Principle” (1978), adding practical examples and clearer rules. This period moved Elliott from a niche idea to a mainstream technical framework.
From print to screens (1990s–2000s).
As charting software matured, counting became easier. Traders combined Elliott with channels, momentum divergence, and volume to validate counts. The community began to standardize naming conventions and degrees.
Modern era (2010s–today).
Platforms like TradingView and data access across Forex, indices, crypto, and commodities made Elliott multi-asset. Best practice now blends:
- Multi-timeframe alignment for the active degree
- Fibonacci retracements (38.2/50/61.8) and extensions (100/161.8) for entries and targets
- Invalidation levels for objective risk control
- A clear signal format (Bias, Entry, SL, TP1–TP3)
Why the history matters for traders.
The theory was born from observation, not curve-fitting. Its evolution added rules, examples, and tools that make Elliott Wave Trading practical today. Knowing this path helps you separate hard rules (e.g., Wave 2 can’t retrace 100% of Wave 1) from soft guidelines (e.g., alternation), and apply them with discipline—so your wave count turns into a trade plan with Entry, SL, and targets.
Structures (Types)
Elliott Wave structures come in two families: motive (push the trend) and corrective (pause or retrace it). Motive waves are usually an Impulse (1–5) or a Diagonal (Leading/Ending). Correctives are Zigzag, Flat, Triangle, or Combinations. Knowing which family you’re in tells you the trade logic: ride Wave 3/5 in motives; fade or wait for the thrust in correctives. Always anchor plans to invalidation and confirm with multi-timeframe context.
Cheat sheet
- Motive: Impulse • Leading Diagonal • Ending Diagonal
- Corrective: Zigzag • Flat • Triangle • W–X–Y (Combinations)
- Signal read: Bias → Entry zone (often Fib) → SL at invalidation → TP1/TP2/TP3 via equality/extension.
1) Motive Waves
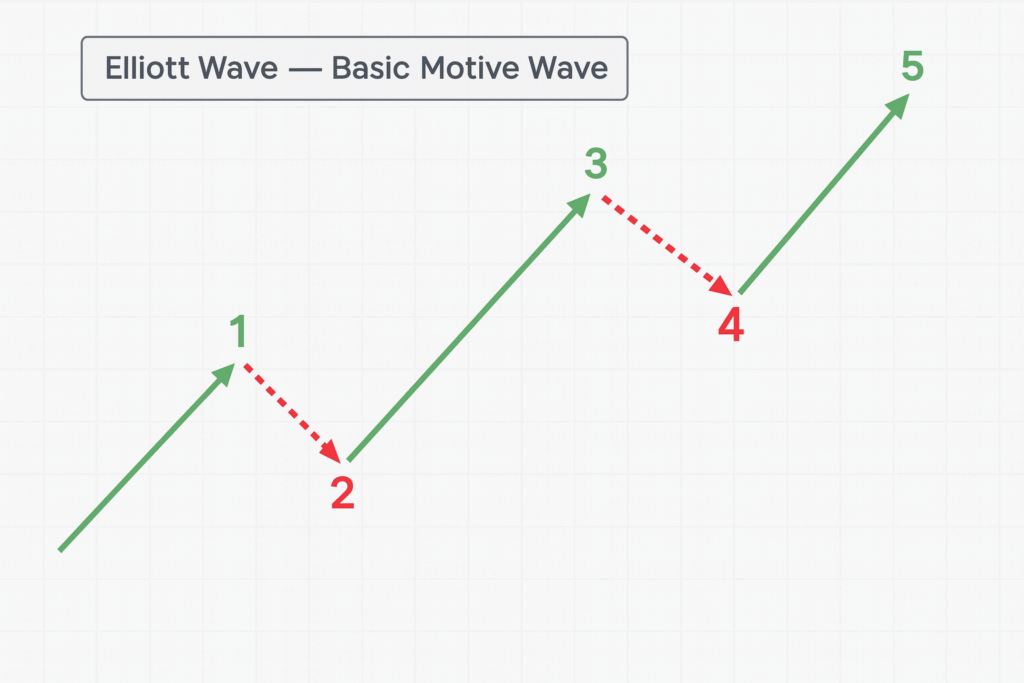
1.1 Impulse (1–2–3–4–5)
Hard rules
- Wave 2 never retraces 100% of Wave 1.
- Wave 3 is never the shortest motive wave (often the strongest).
- Wave 4 typically does not overlap Wave 1’s price territory (except in diagonals).
Guidelines
- Alternation: If Wave 2 is sharp/deep, Wave 4 is often sideways/shallow (and vice-versa).
- Channeling: The 2–4 trendline helps project Wave 5 and spot the break.
Common Fibonacci
- Wave 2 retrace: 38.2–61.8% of Wave 1.
- Wave 3 extension: ~1.000–1.618× Wave 1.
- Wave 5: equality with Wave 1, 0.618 of 1–3, or ~1.618× of Wave 1 in strong trends.
Signal quick template
- Bias: In direction of Wave 3/5
- Entry: Pullback to 38.2–61.8% zone
- SL: Beyond invalidation (start of Wave 1 / below pullback low)
- TP: Equality/1.618 extensions (TP1/TP2/TP3 as structure allows)
1.2 Leading Diagonal
Traits
- Wedge-like structure at the start of a move (Wave 1 or A).
- More internal overlap; commonly labeled 5-3-5-3-5 (some schools allow 3-3-3-3-3).
Guidelines
- A break of the wedge boundary often confirms completion.
- Expect a swift retrace (Wave 2/B) after completion.
Fibonacci
- Wave 2 often retraces up to ~61.8% of Wave 1.
Signal
- Entry: Retest of the broken wedge boundary (or break-and-retest)
- SL: Beyond the opposite wedge side
- TP: Wedge height projection or 100–161.8% extension
1.3 Ending Diagonal
Traits
- Usually appears in Wave 5 or Wave C.
- High overlap, momentum divergence, and frequent throw-over beyond the boundary.
Signal
- Entry: After a decisive break back inside the wedge
- SL: Above/below the throw-over high/low
- TP: At least back to the origin of the diagonal; deeper retraces possible

2) Corrective Waves

2.1 Zigzag (A–B–C, typically 5–3–5)
Traits
- Sharp and directional.
- Wave B is usually short (0.382–0.618 retrace of A).
- Wave C ≈ Wave A or 1.618× A in strong moves.
Where it appears
- Common as Wave 2 or inside complex corrections.
Signal
- Entry: Near the end of B or on a break of B’s trendline
- SL: Beyond B’s extreme / invalidation level
- TP: Equality with A (TP1) and 1.618× A (TP2/TP3)
2.2 Flat (A–B–C, typically 3–3–5)
Types
- Regular Flat: B ≈ 90–100% of A; C slightly exceeds A.
- Expanded (Irregular) Flat: B exceeds the start of A; C often extends beyond A’s end (fake-out risk).
- Running Flat: Strong B; C fails to reach A’s end (signals a very strong larger trend).
Signal
- Entry: Fade the end of C (back in the larger-trend direction) or trade the break of B–C
- SL: Beyond the end of C
- TP: Back to B’s origin or continuation with larger trend
2.3 Triangles (3–3–3–3–3)
Types
- Contracting: Most common; range narrows.
- Expanding: Range widens; rarer.
- Barrier: One boundary is near-horizontal (flat support/resistance).
Where it appears
- Often Wave 4 or Wave B, just before the final thrust.
Signal
- Entry: Trade the post-break thrust
- SL: Inside the triangle, beyond the broken boundary
- TP: Roughly the maximum triangle width projected from the break
2.4 Combinations (W–X–Y [–X–Z])
Traits
- Connects multiple corrections (zigzag/flat/triangle) with one or two X waves.
- Purpose: extend/complicate a corrective phase; often produces sideways price action.
Guidelines
- X waves are typically shallower connectors.
- Start simple; upgrade to “combination” only when rules force it.
Signal
- Entry: Near the completion of Y (or Z) after structure confirmation
- SL: Beyond the structure’s extreme
- TP: Back to the range midline or a decisive range break in the dominant trend direction
3) Degree & Multi-Timeframe (MTF) Alignment
- Build the primary count on HTF (weekly/daily).
- Validate on MTF (H4/H1).
- Refine Entry on LTF with Fib zones, channel touches, and candle confirmation.
- Place invalidation at the same degree as your count; avoid shifting stops arbitrarily.
Quick Recognition Checklist (Fingerprint)
- Shape: Wedge, channel, or range? Any overlap?
- Momentum: Divergence in Wave 5/C?
- Fibonacci: Do common retraces/equalities/extensions align?
- Rules: No hard rule is being violated.
- Context: Is the pattern in a plausible spot (e.g., triangle in 4/B, ending diagonal in 5/C)?
Common Mistakes (and Fixes)
- Forcing the count: Check rules first, then label.
- No invalidation level: Define it numerically before entry.
- Over-complication too early: Start with the simplest valid count; increase complexity only if forced.
- Ignoring MTF: Make cross-timeframe confirmation mandatory.
Mapping Structure → Signal (Summary)
- Impulse: Ride Wave 3/5 with pullback entries; SL at invalidation; targets via equality/extension.
- Leading Diagonal: Break-and-retest of the wedge; anticipate a swift Wave 2/B pullback.
- Ending Diagonal: Trade the reversal after the break; first target is the diagonal’s origin.
- Zigzag: Position near B completion or B-line break; target C = A (and 1.618× A).
- Flat: Fade the end of C; watch for Expanded Flats that trap breakouts.
- Triangle: Wait for the thrust; project target ≈ widest part of the triangle.
- Combinations: Enter near Y/Z completion; SL beyond the structure; aim for midline or range break.
Want charted examples and ready-to-publish signal samples for each pattern? Say the word and I’ll add them in your house style (Bias, Entry, SL, TP1–TP3, Risk, Alternate)
Detailed Explanation: Rules, Ratios, and Execution
1) Hard Rules
-
Wave 2 never retraces 100% of Wave 1.
-
Wave 3 is never the shortest motive wave (it’s often the strongest).
-
Wave 4 typically does not overlap Wave 1’s price territory (exception: diagonals).
-
In A–B–C corrections, internal structures must match the pattern type: Zigzag 5–3–5, Flat 3–3–5, Triangle 3–3–3–3–3.
-
Invalidation must be defined at the same degree as the count—don’t move stops to another degree.
2) Key Guidelines
-
Alternation: If Wave 2 is sharp/deep, Wave 4 tends to be sideways/shallow (and vice-versa).
-
Channeling: The 2–4 trendline helps project Wave 5 and spot the break.
-
Truncation: Wave 5 can fail to make a new high/low; often appears with momentum divergence.
-
Wave personality: Wave 3 carries power/volume; Wave 5 often diverges; B/X waves are tricky.
-
Pattern placement: Triangles usually in Wave 4 or B; Ending Diagonals in Wave 5/C.
-
Start simple: Choose the simplest valid count; upgrade to combinations only if rules force it.
3) Fibonacci Ratios You’ll Use Most
Retracements
-
Wave 2: 38.2%–61.8% of Wave 1
-
Wave 4: 23.6%–38.2% (shallower, more sideways)
Extensions
-
Wave 3: ~100%–161.8% of Wave 1 (can stretch to 261.8% in strong trends)
-
Wave 5: = Wave 1, or 61.8% of 1–3, or ~161.8% of Wave 1 in blow-offs
-
Zigzag: C ≈ A (TP1) or C = 1.618 × A (TP2/TP3)
-
Expanded Flat: C often exceeds A’s end
Confluence matters
Best entries form where Fib retrace + channel boundary + supply/demand + candle confirmation align.
4) Execution Workflow (Step-by-Step)
Step 1 — HTF context
Identify trend, parent wave structure, key zones, and a directional bias on weekly/daily.
Step 2 — MTF count
On H4/H1, label the active wave & degree, draw channels, test Fib zones.
Step 3 — Invalidation (numeric)
Set a precise invalidation level; this defines your SL.
Step 4 — Entry design
Pick the Entry zone at 38.2/50/61.8 retrace or on a valid break (e.g., B-line).
Order type: Limit for pullbacks, Stop for confirmed breaks.
Step 5 — Position size & risk
Use fixed fractional risk (e.g., 0.5–1% per trade).
Position Size = (Account × Risk%) / (SL distance × PipValue)
Target minimum R:R ≥ 1:2.
Step 6 — Targets (TP1/TP2/TP3)
-
TP1: conservative (equality, channel midline, nearby swing)
-
TP2: structural (1.0–1.272–1.618 extensions)
-
TP3: expansion (trend continuation after strong breaks)
After TP1, consider partials and move SL to BE.
Step 7 — Trade management
-
Trail by channel or swing lows/highs on LTF.
-
Watch for divergence into Wave 5; scale out if it appears.
-
If invalidation breaks, exit immediately—no debate.
Step 8 — Alternate scenario
Pre-plan: If X happens, I stand aside / neutralize bias / flip after confirmation.
5) Standard Signal Format (Elliott “Signature”)
-
Analysis (Wave Context): Wave … of …, degree …, channel …, Fib …%. Invalidation: …
-
Bias: Buy / Sell
-
Entry (Zone / Type): … (Limit/Stop)
-
Stop-Loss (SL): At invalidation
-
Targets: TP1 … | TP2 … | TP3 … (Equality/Extension)
-
Risk: % risk and target R:R
-
Timeframe & Confidence: …
-
Alternate / Warning: What breaks the count and the plan if it does
6) Pre-Trade Checklist
-
No hard rule is being violated.
-
MTF alignment holds (HTF → MTF → LTF).
-
Invalidation is numeric and defensible.
-
Entry sits at confluence (Fib/Channel/Structure) with candle confirmation.
-
TP1/TP2/TP3 are logical and give R:R ≥ 1:2.
-
Alternate is documented.
7) Common Pitfalls (and Fast Fixes)
-
Forcing the count → Validate rules first, then label.
-
Arbitrary SL → SL = invalidation at the same degree as the count.
-
Over-complication too early → Start simple; escalate only when rules demand it.
-
Ignoring post-entry management → Prewrite trailing, partials, and exit criteria.
Bottom line: Hard rules, Fibonacci structure, and MTF alignment are the backbone of Elliott Wave Trading. With clear invalidation, confluence-based entries, and numeric risk control, your count becomes a trade-ready setup.
Conclusion
Elliott Wave isn’t a crystal ball—it’s a decision framework. Its real edge comes from three pillars: clear scenarios, numeric invalidation, and disciplined execution. By aligning counts across timeframes, using Fibonacci and channeling, and tying SL to invalidation, you turn a wave label into a trade-ready plan with TP1/TP2/TP3.
How to turn a count into a trade
- Start on HTF to define trend and context.
- Set invalidation first and keep risk fixed (e.g., 0.5–1% per trade).
- Enter only at confluence (Fib + channel + structure + candle confirmation).
- Manage with partials and a trail; exit immediately if invalidation breaks.
- Always write an alternate and the flip plan in advance.
Working formula:
Scenario → Entry at confluence → SL = invalidation → TP1/TP2/TP3 via equality/extension → Fixed risk and R:R ≥ 1:2 → Neutral updates as new data arrives.
Want ready-to-trade setups? Our Elliott-based live signals are free to view here: FastPip Elliott Wave Signals.
Reputable English Resources (learn more)
- Elliott Wave International (EWI) – Education hub: free articles, Waveopedia, books, videos, on-demand courses. Great primary source.
- StockCharts ChartSchool – Elliott Wave: concise, regularly updated explainers and guidelines.
- Investopedia – Elliott Wave: neutral overview and pros/cons; good for quick refreshers.
- BabyPips School – Elliott Wave: step-by-step lessons and trading examples (forex-friendly).
- CMT Association – Talks & prep: webinars and learning objectives that include Elliott concepts.
- TradingView – Community ideas: practice reading counts, compare alternates (use for examples, not rules).
Recommended learning package
- EWI – “Elliott Wave Educational Series” (10 lessons): a structured video course to apply Elliott across markets & timeframes. Ideal starter “mini-curriculum.”