Fundamental or Technical Analysis: A Game-Changing Choice for Traders
This article compares the two methods to help you make smarter trading decisions
Introduction
The financial markets, especially Forex, are full of opportunities but also risks. One of the most common questions traders ask is: Should I rely on fundamental analysis or technical analysis for better results?
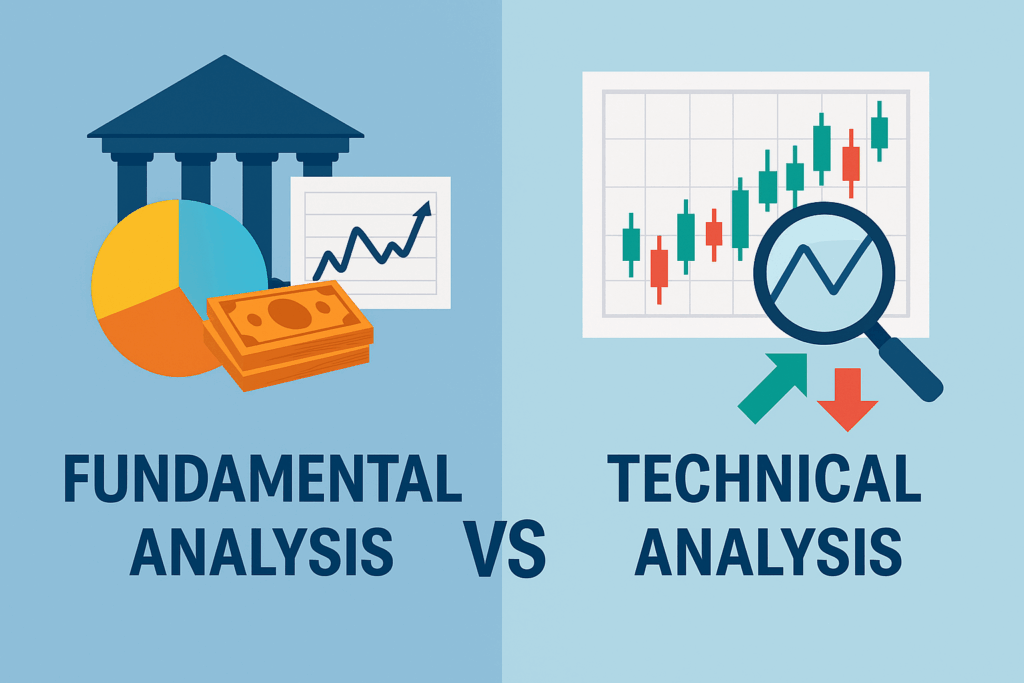
Fundamental analysis focuses on economic, political, and social factors that determine the real value of assets, while technical analysis studies price charts and historical patterns to forecast future movements.
Making the right choice can be the difference between profit and loss.
If you want to save time and use professional trading insights, check out our trading signals page and take advantage of ready-to-use strategies.

What Is Fundamental Analysis?
Fundamental analysis is not limited to major economic news releases like interest rate decisions or employment reports. Instead, it covers a broad spectrum of economic, political, and even social factors that shape the real value of assets and long-term market direction. These include:
- Central bank monetary and fiscal policies
- Exchange rate shifts and trade balance data
- Government debt levels and budget deficits
- Political decisions, sanctions, and geopolitical tensions
- Social and technological changes that may impact markets
By considering this wider range of information, fundamental analysis provides traders with a comprehensive understanding of market dynamics beyond short-term fluctuations.
It is also important to note that the release of economic data often triggers significant volatility. Many traders use these events to generate profits. If you want to learn how to trade effectively during such periods, we recommend reading our article on the News trading strategy
What Is Technical Analysis?
Technical analysis is a trading method that focuses on price action and historical data rather than economic fundamentals. The core belief is that “price reflects everything,” meaning that all available information—whether economic, political, or psychological—has already been factored into the market price.
Traders use a wide variety of tools in technical analysis, including:
- Chart patterns such as head and shoulders, triangles, and double tops/bottoms
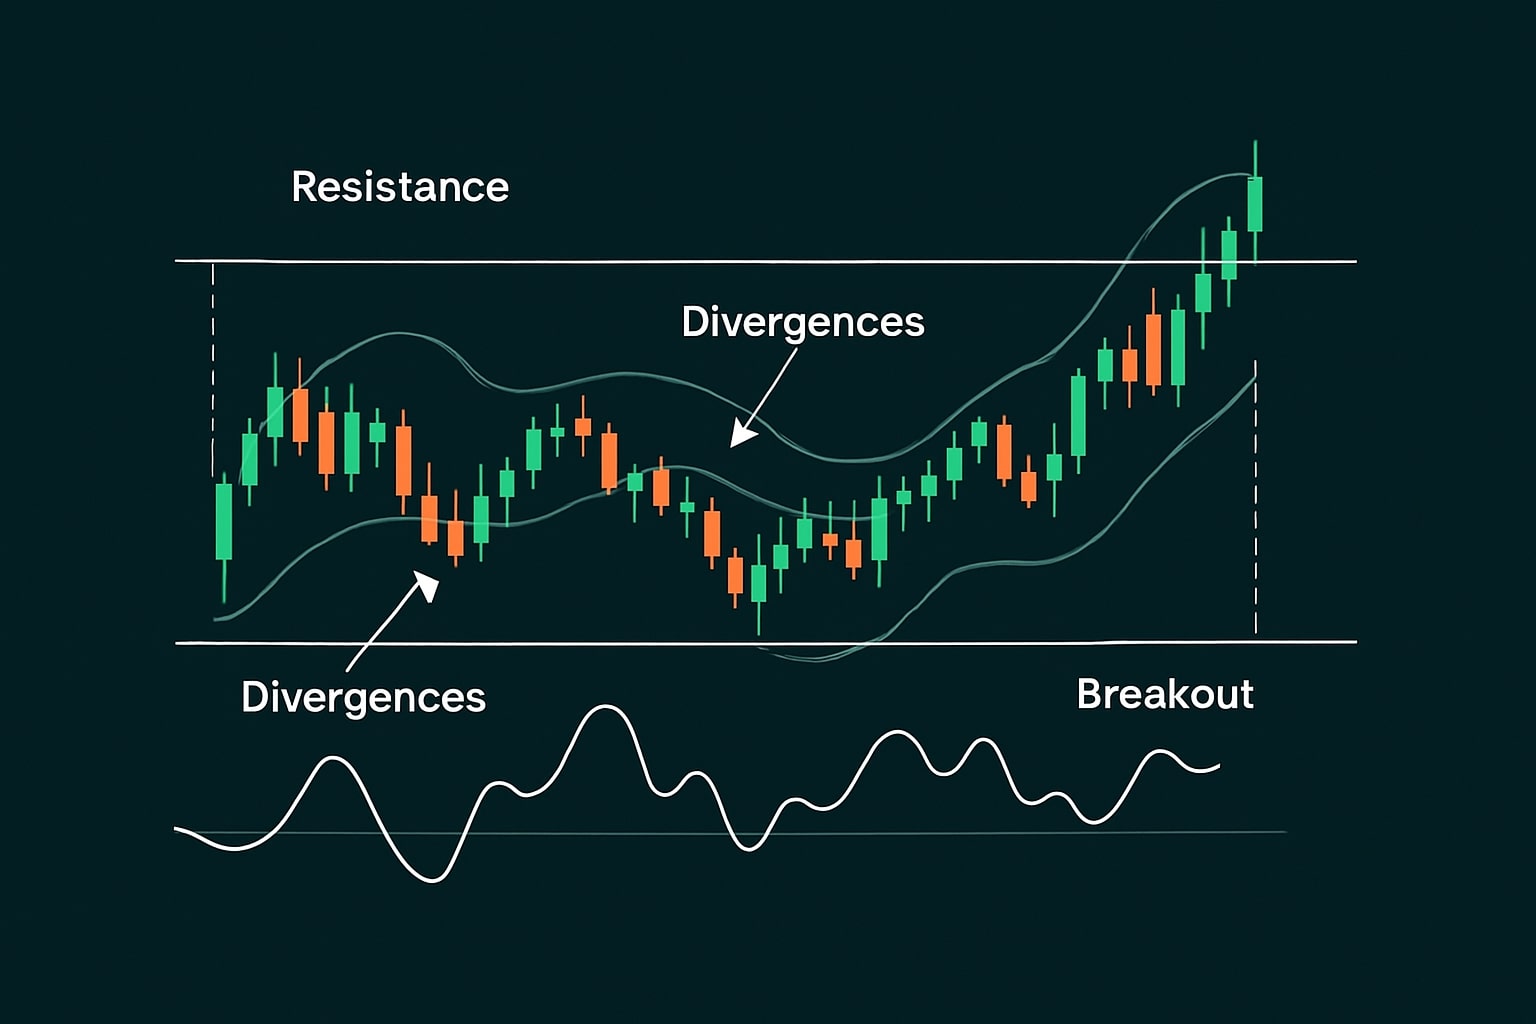
- Indicators and oscillators like Moving Averages, RSI, MACD, and Bollinger Bands
- Support and resistance levels to identify key price zones
- Candlestick patterns that reveal market sentiment
- Volume analysis to confirm the strength of trends
Technical analysis can be applied across different markets (Forex, stocks, commodities, and crypto) and on various timeframes, from scalping on a 1-minute chart to long-term position trading on weekly or monthly charts.
Pros:
- Provides quick and actionable entry and exit signals
- Flexible across multiple timeframes and asset classes
- Helps visualize market psychology through price action
Cons:
- Ignores underlying fundamental factors that may drive long-term trends
- Can generate false signals, especially during periods of high volatility or low liquidity
- Requires continuous learning, backtesting, and discipline to master
In practice, many traders use technical analysis for timing trades, while relying on fundamental analysis to understand the bigger picture. When combined, the two methods create a more balanced and reliable approach to trading.
Comparison: Which Is Better?
When evaluating fundamental analysis vs technical analysis, it’s essential to understand that neither method alone is sufficient for consistent trading success.
- Relying only on fundamental analysis may help you understand the big picture, but it often fails to provide precise entry and exit points.
- Depending solely on technical analysis may give you quick trade setups, but without fundamentals, you risk trading against the underlying trend.
That is why the best approach is to combine both methods:
- Use fundamentals to determine the overall market direction and long-term bias.
- Apply technicals to fine-tune trade timing and manage entries and exits.
However, even combining both tools is not enough without a well-structured trading strategy. A strategy defines your rules, risk management, and discipline, ensuring that you trade consistently rather than emotionally.
If you want to learn how to build a reliable system, we recommend reading our article on the principles of designing a trading strategy.
✅ Pros and Cons Table
| Aspect | Fundamental Analysis | Technical Analysis |
|---|---|---|
| Focus | Economic data, policy decisions, intrinsic value | Price action, chart patterns, indicators |
| Strengths (Pros) | – Identifies long-term trends – Evaluates real value – Anticipates news impact | – Quick entry/exit signals – Works across timeframes – Visualizes market psychology |
| Weaknesses (Cons) | – Complex, knowledge-intensive – Slow for short-term trades – May miss timing opportunities | – Ignores fundamentals – False signals in volatility – Requires ongoing practice |
| Best For | Long-term investors and macro traders | Short-term traders, scalpers, swing traders |
✅ References
- Murphy, John J. Technical Analysis of the Financial Markets. New York Institute of Finance.
- Investopedia – Fundamental Analysis vs Technical Analysis
- Federal Reserve – Monetary Policy Reports
- European Central Bank – Economic Bulletin
- Babypips – School of Pipsology (Forex Education)


