
Macroeconomic Indicators 2025: A Comparative Analysis of the World’s Leading Economies
Introduction
The global economy in 2025 is navigating a complex landscape—marked by both rising uncertainty and new growth opportunities. To truly understand where the world’s leading economies stand today and where they may be headed, analyzing macroeconomic indicators is essential.
Key metrics such as Gross Domestic Product (GDP), growth rate, inflation, unemployment, government debt, and current account balance offer a comprehensive view of a country’s economic strength and long-term stability. These indicators don’t just reflect national performance—they also shape global trade flows, investment sentiment, and currency valuations.
At Fastpip, we use macroeconomic data to enhance our copy trading strategies and refine our real-time trading signals. A deeper understanding of macro trends allows traders to anticipate market reactions, align their risk exposure, and seize smarter opportunities across Forex and crypto markets.
In this article, we’ll explore the most recent macroeconomic data for the top world economies—providing a side-by-side comparison to help you interpret global trends, assess risks, and make informed investment decisions.
This article examines 13 of the world’s leading economies using the most recent data available as of July 2025. Join us as we explore which countries are on a path of sustained growth—and which ones are facing serious headwinds.
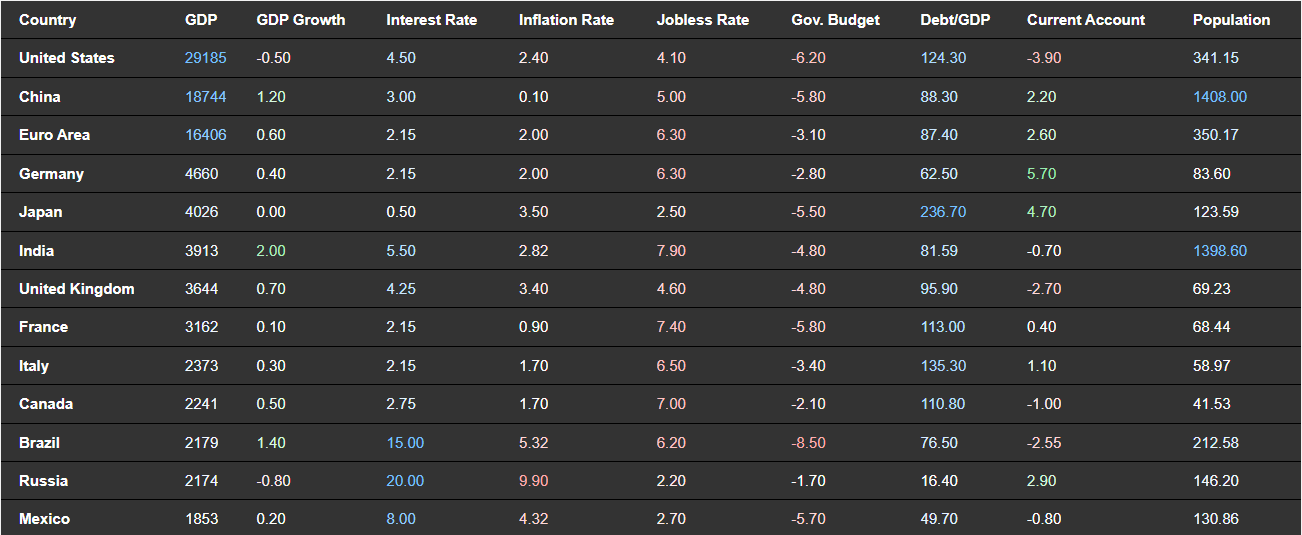
| Country | GDP (USD Bn) | GDP Growth (%) | Interest Rate (%) | Inflation Rate (%) | Unemployment Rate (%) | Gov. Budget (% GDP) | Debt/GDP (%) | Current Account (% GDP) | Population (Mn) |
| USA | 28000 | 2.6 | 5.5 | 3.3 | 4.1 | -6.5 | 122 | -3.2 | 341.2 |
| China | 17700 | 5 | 3.45 | 0.2 | 5 | -3 | 88 | 1.2 | 1408 |
| Euro Area | 14000 | 0.5 | 4.25 | 2.5 | 6.5 | -3.4 | 91 | 2.1 | 350.2 |
| Germany | 4400 | 0.2 | 4.25 | 2.8 | 5.9 | -2.5 | 64 | 5.8 | 83.6 |
| Japan | 4100 | 0.6 | -0.1 | 2.8 | 2.6 | -6.4 | 262 | 3.4 | 123.6 |
| India | 3900 | 7.8 | 6.5 | 5.4 | 7.6 | -5.9 | 81.6 | -2.1 | 1398.6 |
| UK | 3200 | 0.4 | 5.25 | 2.3 | 4.3 | -5.2 | 96 | -4 | 69.2 |
| France | 3000 | 0.4 | 4 | 2.6 | 7.5 | -5.1 | 113 | -2.9 | 68.4 |
| Italy | 2700 | 0.8 | 4 | 1.9 | 7 | -4.5 | 137 | -1.7 | 59 |
| Canada | 2300 | 1.4 | 5 | 2.9 | 6.2 | -3 | 110 | -2.6 | 41.5 |
| Brazil | 2200 | 2.2 | 10.5 | 4.3 | 7.8 | -4.2 | 77 | 0.8 | 212.6 |
| Russia | 2100 | -0.8 | 16 | 5.9 | 3 | 0.6 | 14.5 | 10 | 146.2 |
| Mexico | 1900 | 2 | 11 | 4.5 | 3.5 | 0.9 | 49 | -0.9 | 130.9 |
Part 1: GDP and Economic Growth
Analysis of key macroeconomic indicators by country
Gross Domestic Product (GDP) is one of the most important macroeconomic indicators for measuring a country’s size and economic strength. It represents the total value of all final goods and services produced within a country in a given year. If you’re not familiar with the concept of GDP, we recommend reading our article: What Is GDP? The Secret Behind Advanced Economies.
As of July 2025, the United States remains the world’s largest economy with a GDP of approximately $28 trillion. China follows with $17.7 trillion. The Euro Area, as a unified economic bloc, holds third place, followed by Germany, Japan, and India.
In terms of economic growth, India leads with an impressive growth rate of 7.8%. This reflects the country’s dynamic development in sectors such as manufacturing, services, and technology. In contrast, Russia’s economy has contracted by -0.8%, likely due to sanctions, declining foreign investment, and inflationary pressures.
Another notable observation is the sluggish growth seen in developed countries like Germany, Japan, and France. This may be attributed to tight monetary policies, aging populations, and declining global demand.
Part 2: Interest Rates and Inflation
Interest rates and inflation are two of the most critical tools used in central banks’ monetary policy. These indicators directly impact economic growth, investment, financial markets, and consumer purchasing power.
But what is inflation?
Inflation refers to the general and sustained increase in the price level of goods and services within an economy. When inflation rises, purchasing power falls, as people can buy less with the same amount of money. Controlling inflation is one of the primary goals of central banks worldwide.
In July 2025, Russia and Brazil are implementing aggressive tightening policies, with high interest rates of 16% and 10.5% respectively, in an effort to curb inflation. In contrast, the Euro Area, Japan, and China are maintaining lower interest rates to stimulate growth.
India (5.4%) and Russia (5.9%) report the highest inflation rates among the analyzed countries, which could negatively affect living standards and economic stability. Meanwhile, Japan (2.8%) and China (0.2%) appear to have relatively stable inflation conditions.
In many economies, raising interest rates is intended to reduce inflation, but it can also suppress growth. For instance, Germany and Canada face this trade-off, showing high interest rates alongside weak economic growth, indicating increased financial pressure.
Part 3: Unemployment and the Labour Market
Unemployment rate is another key macroeconomic indicator used to assess the health of a country’s labour market. It reflects the percentage of the economically active population (those able and willing to work) who are currently jobless but actively seeking employment. A high unemployment rate may indicate recession, reduced investment, or structural issues within the economy.
Among the 13 countries analysed, India (7.6%) and France (7.5%) have the highest unemployment rates. These figures may be driven by large youth populations, shifts in labor structure, or slower economic growth. Canada, with a rate of 6.2%, also falls into the category of high-unemployment economies.
In contrast, Russia (3.0%) and Japan (2.6%) report the lowest unemployment rates. However, low unemployment does not always reflect a healthy job market; it may also signal low labour force participation or a high share of informal employment.
The U.S. (4.1%) and UK (4.3%) remain within balanced ranges, often seen in dynamic and growing labour markets.
Analyzing unemployment alongside other indicators like GDP growth and inflation provides a more complete view of an economy. Countries with high joblessness need structural reforms, support for small businesses, and skill development programs to improve employment.
Part 4: Government Budget and Debt-to-GDP Ratio
The debt-to-GDP ratio is a critical metric for evaluating a country’s fiscal sustainability. It shows how much debt the government owes relative to the size of its economy. A high ratio can suggest financial stress, overreliance on borrowing, or weak budgetary discipline.
As of July 2025, Japan has the highest public debt ratio at 262% of GDP, driven by decades of expansionary fiscal policies, an ageing population, and low growth. Italy (137%) and the U.S. (122%) follow.
In contrast, Russia, with just 14.5%, maintains the lowest debt level, which may reflect cautious fiscal management or limited access to global credit markets. Mexico and China also report relatively low debt levels.
In terms of fiscal budget, countries with high deficits usually rely on borrowing to cover expenditures. For instance, the U.S., France, and the UK are running deficits of more than 4% of GDP, which may lead to long-term debt growth and upward pressure on interest rates.
Meanwhile, Russia and Mexico have posted budget surpluses, which can help strengthen foreign reserves and reduce inflationary risks.
Evaluating both the budget balance and debt ratio together provides insight into the overall fiscal health of a nation. Countries facing high debt and low growth could be at risk of credit rating downgrades or debt crises in the future.
Part 5: Current Account and Population
The current account is a vital part of a nation’s balance of payments. It measures the difference between exports and imports of goods, services, income, and transfers. A surplus indicates strong exports and capital inflows, while a deficit implies reliance on foreign financing.
Among the countries studied, Russia leads with a 10% current account surplus, followed by Germany, Japan, and China, all of which are strong exporters in sectors like energy, automobiles, and technology.
Conversely, the UK, France, India, and Mexico are running current account deficits. For example, the UK’s -2.8% balance suggests a high dependency on imports and external capital.
Population is another major factor in economic analysis. China and India, with over 1.4 and 1.3 billion people respectively, have massive internal markets and abundant labour forces. These demographics offer long-term growth potential and rising domestic demand.
On the other hand, countries like Canada, Italy, and France, with populations under 70 million, may need strategic plans to maintain growth in the face of demographic decline and ageing workforces.
Combining current account data with population trends helps assess a country’s global competitiveness, investor appeal, and long-term growth stability.
“These macroeconomic indicators reveal the structural strengths and weaknesses of each nation.”
Conclusion and Final Analysis
“No single indicator alone is sufficient; only a combination of macroeconomic indicators provides a full picture.”
The analysis of macroeconomic indicators across 13 major world economies in 2025 reveals that the global economy remains unstable and increasingly multipolar. Developed nations face challenges such as low growth, high debt, and ageing populations, while emerging economies benefit from rapid expansion, large internal markets, and new opportunities.
The United States remains the largest economy in the world, though it is burdened by heavy debt and a widening fiscal deficit. China and India, as emerging rivals, hold strategic positions in the global economy due to their high growth rates and massive populations.
Japan and Germany, despite their efficiency and innovation, are at risk of long-term stagnation because of demographic decline and sluggish growth. Russia, although struggling with inflation and interest rate pressures, maintains a unique structure marked by a strong trade surplus and minimal government debt.
This comparison makes one thing clear: no single indicator can fully capture the economic condition of a country. A comprehensive understanding requires examining GDP, growth, inflation, unemployment, debt, population, and external trade together.
📌 For deeper insights into individual indicators, explore our expert articles in the blog section, and follow FastPip.com for the latest global economic analysis.
Also, don’t miss our article:
👉 Top 10 World Economies: Who Leads and Why?
All data used in this article are based on the latest statistics available as of July 10, 2025, from the trusted website TradingEconomics.com.