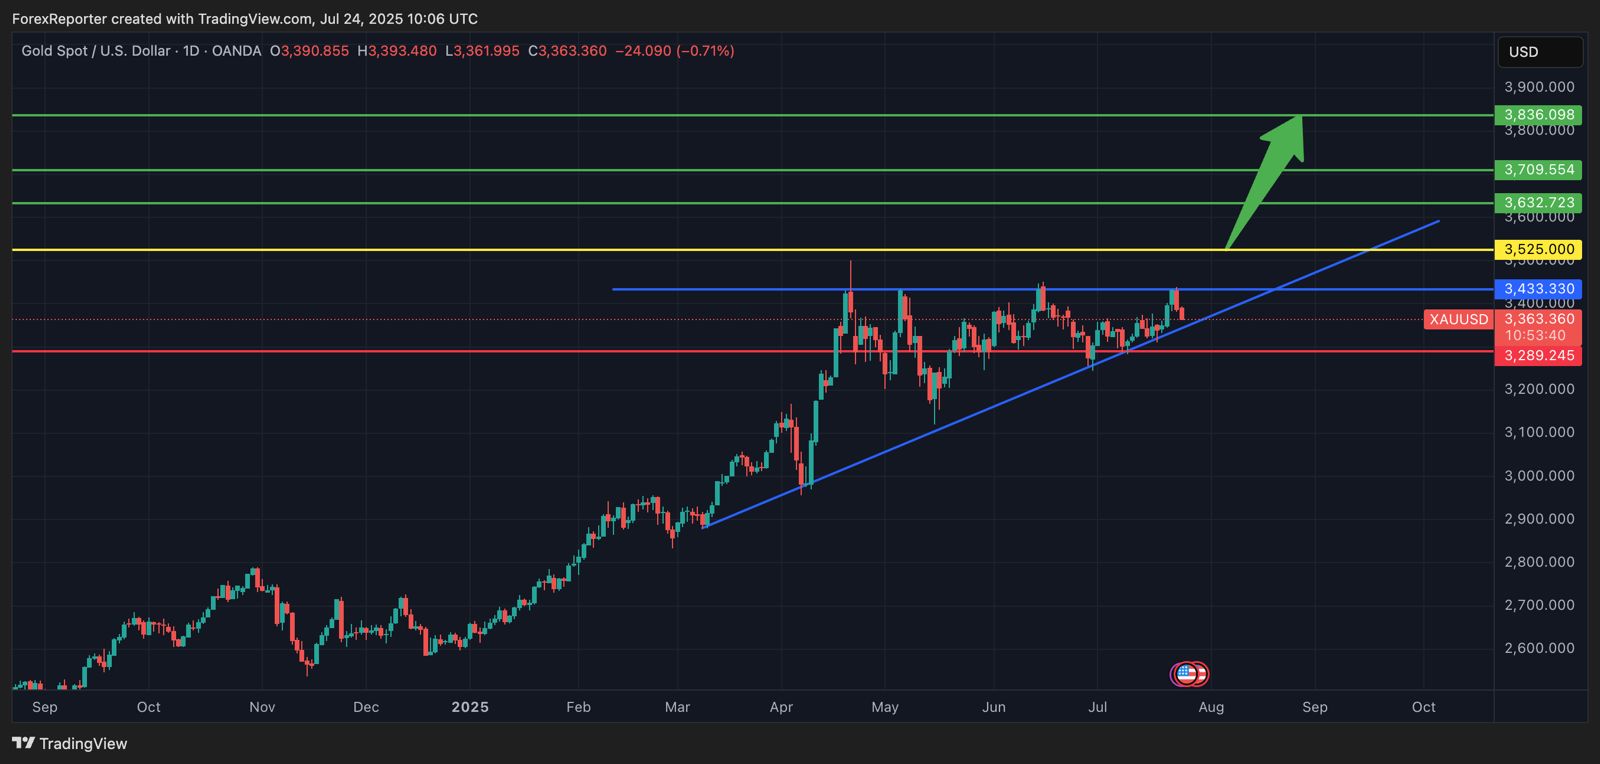
Gold Weekly Chart (XAU/USD): Potential Breakout Toward 3,800+
Report:
On the weekly chart of Gold (XAU/USD), price has formed a strong ascending triangle with consistent higher lows since March 2025. The breakout of the key resistance zone at $3,525 signals the possibility of a long-term bullish move.
A breakout above this level may push the price toward Fibonacci-derived long-term targets. The current pattern suggests bullish momentum is building up.
⚠️ Note: This is a weekly long-term chart. If using this signal for trading, consider using smaller lot sizes due to wider stop loss and time horizon.
Signals
- Enter: Above $3,525
- Target A: $3,632
- Target B: $3,836
- SL: $3,289
🟡 Important Note – Gold Long-Term Outlook (Weekly Chart)
While we have issued a long-term buy signal above $3,525, it’s important to emphasize:
📌 If your trading capital is limited, please treat this as a strategic long-term analysis, not a short-term trade recommendation.
📈 This setup is based on the weekly time frame, and it may take significant time to develop. It also involves wider stop losses, requiring both patience and careful position sizing.
✅ For experienced traders with sufficient capital and risk tolerance, this setup could offer solid upside potential toward $3,836.


