
🟡 Elliott Wave Technical Analysis – XAUUSD (New Week, 1H Timeframe)
In summary, this Gold (XAUUSD) Elliott Wave Analysis suggests a preferred bullish setup above 3650, with clear stop-loss and profit targets.
🔹 Wave Structure
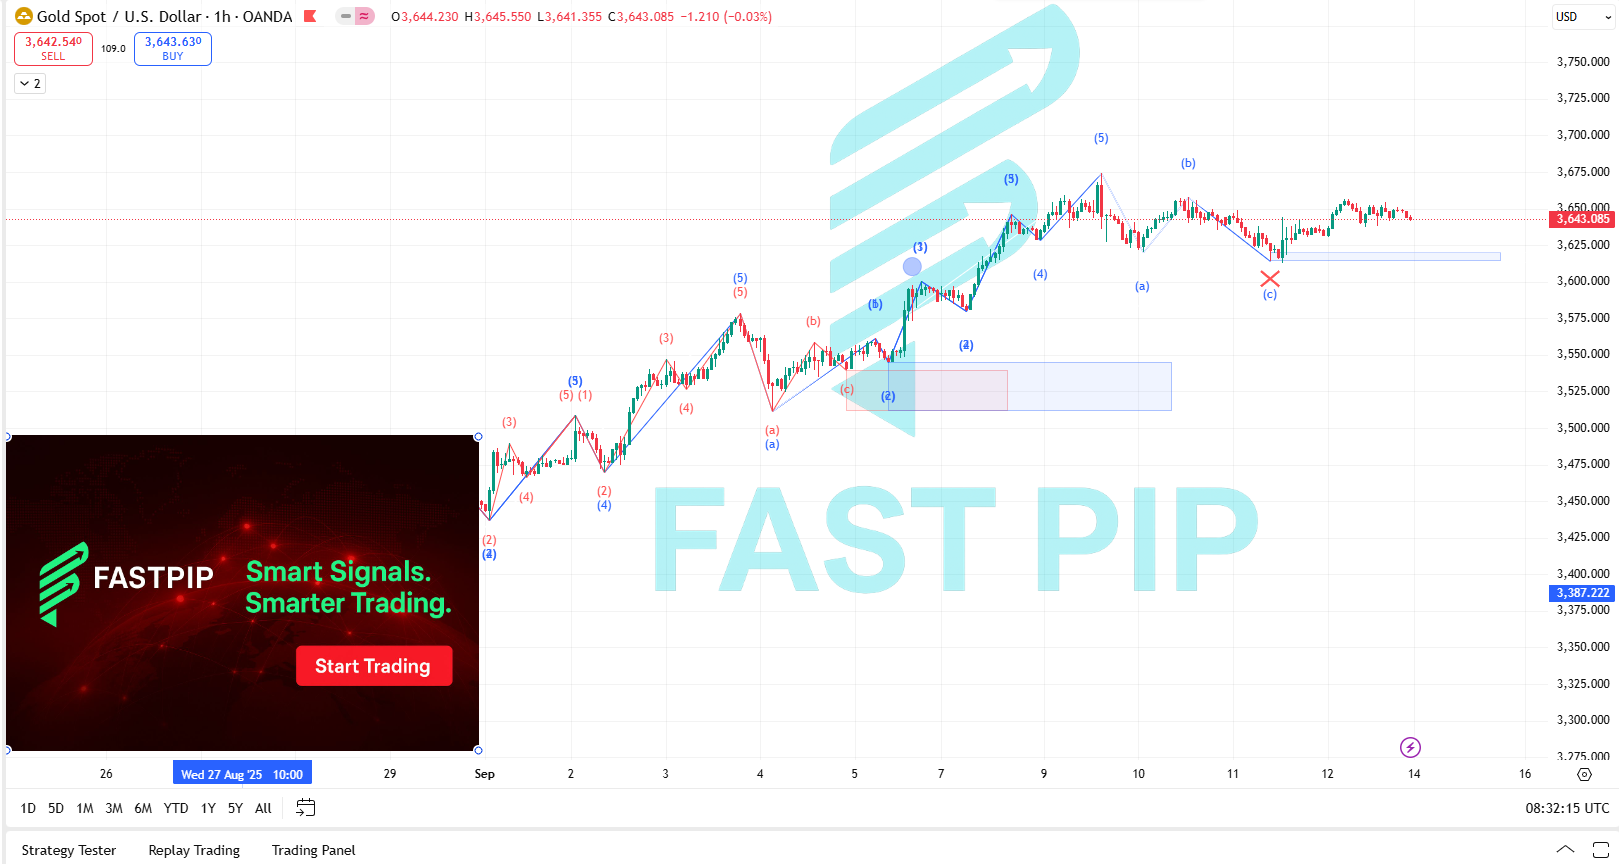
Since late August, Gold has completed a clear five-wave impulsive rally that peaked near 3680. This move unfolded through waves (1) to (5). After the fifth wave topped, a corrective three-wave structure (a–b–c) developed, retesting the 3620–3600 support zone.
The correction appears to have ended, and price is now consolidating around 3640, preparing for the next move as the new trading week begins.
🔹 Current Situation
- Key Support: 3620–3600
- Immediate Resistance: 3665
- Major Resistance: 3700
As long as price holds above 3600, the medium-term bullish structure remains valid. A break above 3665 could trigger the next bullish sequence.
🔹 Main Scenario (Bullish – Preferred)
- Entry (Buy): Above 3645–3650
- Stop Loss (SL): Below 3600
- Targets (TP):
- First target: 3665–3670
- Second target: 3700–3720
- Extended target: 3750 if momentum continues
🔹 Alternative Scenario (Bearish – Lower Probability)
If price breaks below 3600, the current bullish count will be invalidated. In that case, a deeper correction may unfold toward the 3540–3520 zone, and possibly down to 3480 if selling pressure increases.
🔹 Signal Summary
📈 Preferred: Buy above 3650 with targets at 3670 and 3700, SL below 3600
📉 Alternative: Sell only if price breaks 3600, with downside potential to 3540
⚠️ Disclaimer: This outlook is based purely on Elliott Wave technical analysis. Market behavior can change rapidly due to fundamental news, such as inflation data or Federal Reserve policy updates. Always use proper risk management and protective stop-loss orders when trading.
📌 More from FastPip
🔗 Read More on Our Blog:
Discover in-depth articles on trading strategies, Elliott Wave, and market insights on our FastPip Blog.
🔗 Check Our Signals:
Follow real-time trading setups and performance on the FastPip Signals page.