WSS_Platinum Forex Strategy: How to Trade Smarter Using Proven Indicator-Based Signals
Introduction
WSS_Platinum Forex Strategy is a structured trading system designed to bring clarity and consistency to technical trading. Built on a powerful combination of indicators, it helps traders identify market trends, optimal entry points, and high-probability exit zones with greater precision.
Unlike basic trading approaches, WSS_Platinum filters out noise and weak setups—focusing only on trades with the highest probability of success. This makes it ideal for traders who value discipline, structure, and consistent performance.
The strategy integrates tools such as moving averages, dynamic support and resistance zones, and real-time trend strength meters. Together, these elements create a cohesive system that generates actionable signals in both trending and ranging markets.
At Fastpip, we use the WSS_Platinum system not just for education—but for real trading. Our copy trading portfolios and signal services are built around this strategy, allowing users to either learn and apply it themselves or automatically benefit from its performance through expert-guided execution.
In this article, you’ll learn how to apply the WSS_Platinum Forex Strategy step by step—gaining the skills to trade smarter and with more confidence in real market conditions.
✅ Benefits of the WSS_Platinum Forex Strategy
WSS_Platinum Forex Strategy offers multiple advantages to traders seeking structure, clarity, and consistency in the market. It goes beyond basic setups by combining several technical tools into a unified decision-making system.
1. Multi-indicator confirmation
This strategy uses several indicators together—such as trend filters, moving averages, and price zones—to confirm signals. It reduces false entries and increases confidence.
2. Real-time trend strength detection
With built-in ADX and trend bar analysis, traders can measure the strength of a trend before entering. This avoids weak or sideways market conditions.
3. Visual and text-based signals
The system provides clear entry signals using arrows, colour zones, and on-screen messages. Traders don’t need to guess or over-analyze.
4. Defined trading zones
WSS_Platinum highlights buy/sell areas, warning zones, and pivot levels. These zones guide traders on where to enter or avoid trades.
5. Time-filtered entries
A built-in session timer helps users avoid trading during low-volume hours. This keeps trades aligned with high-liquidity market sessions.
6. Compatible with trade journaling and copy trading
Traders can document signals easily and even automate the strategy for copy trading systems. It works well in both manual and semi-automated setups.
Technical Components of the WSS_Platinum Forex Strategy
WSS_Platinum Forex Strategy is built on a set of specialized indicators. Each indicator plays a specific role and contributes to a unified and structured trading system.
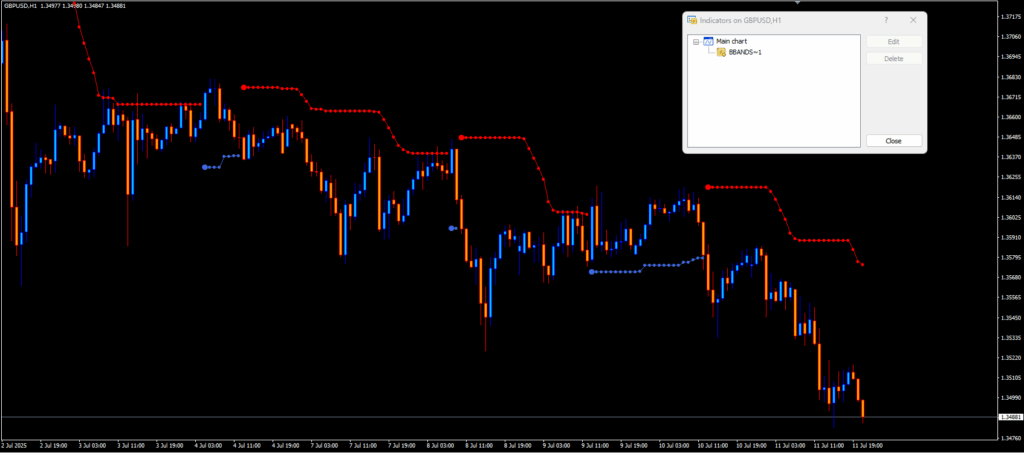
1. BBANDS~1 (Simplified Bollinger Bands)
The BBANDS~1 indicator is a lightweight and customized version of traditional Bollinger Bands. In the WSS_Platinum system, it identifies key volatility zones and highlights areas of potential market reversal.
Visual Behavior:
- 🔴 Red dots indicate dynamic resistance or overbought conditions
- 🔵 Blue dots mark dynamic support or oversold areas
- Color shifts often coincide with momentum changes or market turning points
This simplified visual display allows traders to interpret market conditions faster than using standard Bollinger Bands.
Default Parameters:
Length = 20: Moving average period for the band calculationDeviation = 2: Standard deviation to define band widthMoneyRisk = 1.0: Risk sensitivity level for signal triggeringSignal = 1: Enables signal alerts when bands are crossedSoundON = true: Audio alert when signal conditions are metNbars = 1000: Number of candles used in calculation
Role in the Strategy:
BBANDS1 acts as a supportive filter in the WSS_Platinum framework. It helps detect price compression or expansion, as well as overbought and oversold conditions. When combined with other indicators, BBANDS1 improves timing for entries and exits and reduces reliance on a single signal source.
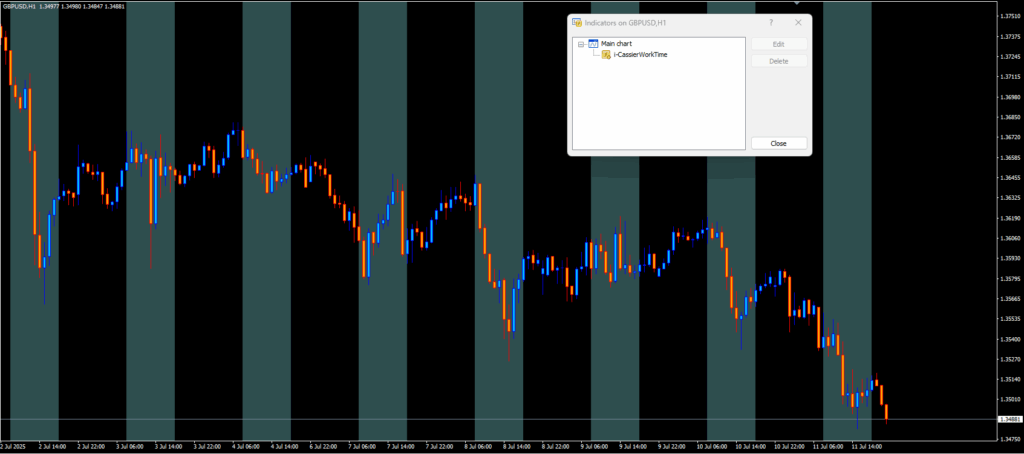
2. i-CassierWorkTime
The i-CassierWorkTime indicator is used in the WSS_Platinum Forex Strategy to highlight specific time zones directly on the chart. It helps traders visually identify periods of high market activity and stronger price reactions.
How It Works:
This tool uses vertical colored bands to mark active trading hours on the chart.
By default, the zone between 08:00 and 18:00 is highlighted in DarkSlateGray, typically representing the overlap between the London and New York sessions.
Key Input Parameters:
-
NumberOfDays = 50: Displays the session boxes for the past 50 days -
Begin_1 = 08:00/End_1 = 18:00: Main active market hours -
Color_1 = DarkSlateGray: Color used for the primary session block -
HighRange = false: Disables volatility-based color changes
Role in the Strategy:
By marking the most relevant hours on the chart, this indicator allows traders to:
-
Quickly spot high-volume or high-volatility periods
-
Focus their analysis on the most active parts of the trading day
-
Avoid trading during slow or risky off-hours
In the WSS_Platinum system, this tool acts as a time-based filter. It ensures that signals are aligned not only with market structure but also with the most liquid trading sessions.
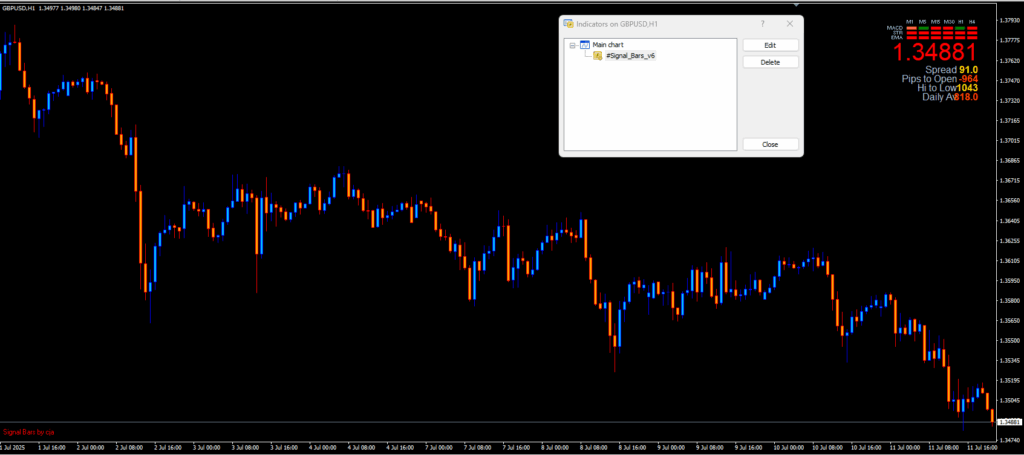
3. #signal_Bar_V6
The #signal_Bar_V6 indicator is a core component of the WSS_Platinum Forex Strategy. It provides a compact, graphical overview of the overall market condition. This tool displays a multi-timeframe summary panel in one corner of the chart, showing real-time data from key technical indicators.
Information Displayed:
-
MACD / Strength / EMA:
Shows the status of three essential indicators across timeframes from M1 to H4.
Green blocks indicate bullish conditions; red blocks indicate bearish signals. -
Live Price:
The large central red number displays the current market price. -
Spread:
Shows the real-time bid-ask spread in yellow, helping traders assess trading costs. -
Pips to Open:
Indicates the difference in pips between the current price and the daily open. A negative value means the price is below the day’s open. -
Hi to Low:
Displays the total range of the current day’s movement from high to low, helping evaluate volatility. -
Daily ATR:
Shows the Average True Range (ATR) in orange, reflecting daily volatility. Traders often use it to set take-profit or stop-loss levels.
Role in the Strategy:
This compact dashboard gives traders a quick and structured view of market conditions. It’s especially useful for fast decision-making, as it summarizes multiple layers of data without requiring deep chart analysis. The indicator ensures that traders can validate trend alignment and volatility context before entering a trade.
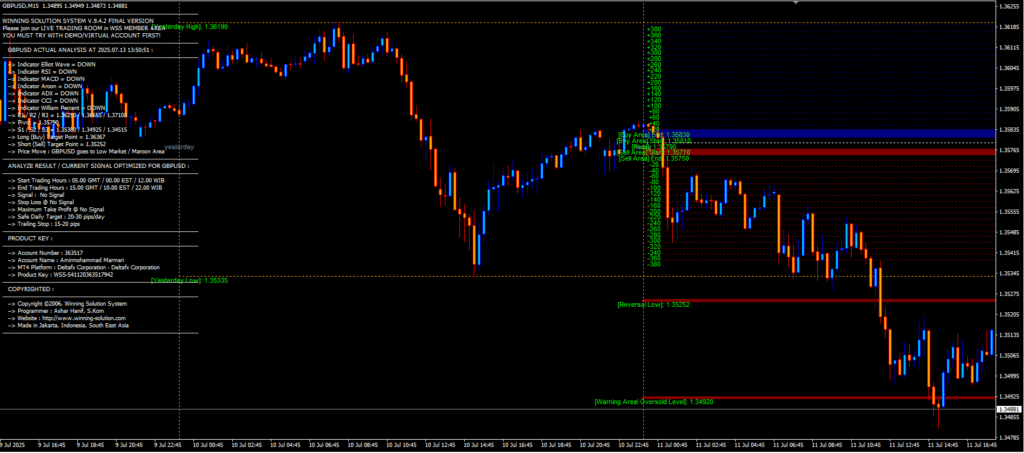
4. _WSS-Graphics
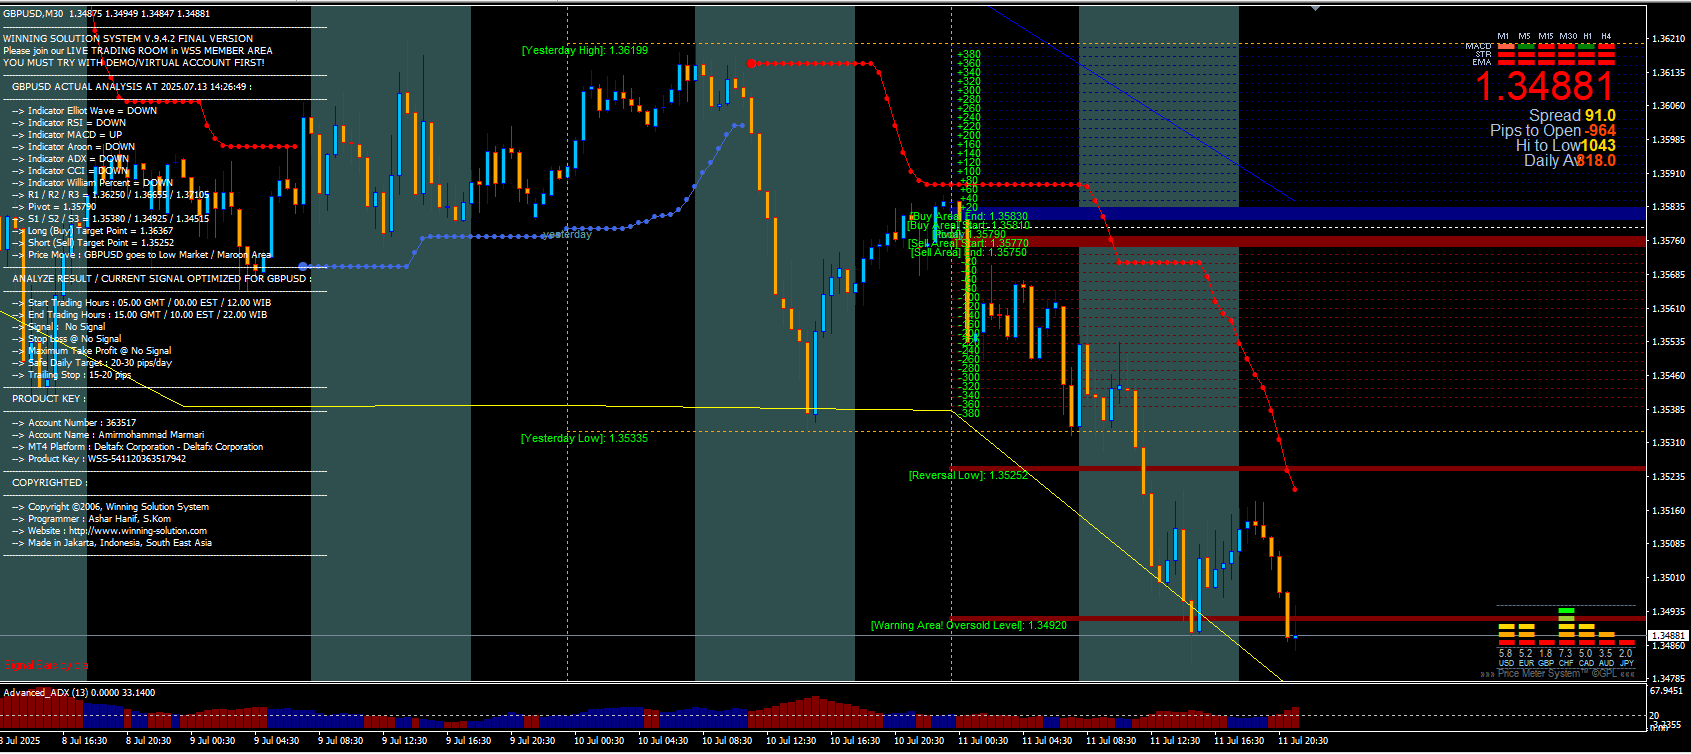
The _WSS-Graphics indicator is the graphical core of the WSS_Platinum Forex Strategy. It manages all visual and text-based elements of the system directly on the chart. This tool allows traders to access live analysis, signals, key price levels, and alerts at a glance.
Live On-Chart Information:
Based on the reference screenshot, this indicator displays the following real-time data:
-
Actual Analysis:
Shows directional signals from key indicators such as:-
Elliot Wave
-
RSI
-
MACD
-
CCI
-
ADX
-
EMA
-
Stochastic
-
-
Key Price Levels:
-
Daily Pivot Points
-
Buy Area and Sell Area zones
-
Reversal Low level
-
Overbought/Oversold Warning Zones
-
-
Trade Recommendation Panel (Analyze Result):
-
Suggested entry/exit signals
-
Recommended trading hours (Start/End time)
-
Daily target (20–30 pips)
-
Proposed Stop Loss, Take Profit, and Trailing Stop values
-
-
Account and License Info:
Displays account number, user name, broker name, and license key
Indicator Parameters and Customization:
The second screenshot shows adjustable settings for visual output. Key options include:
-
ShowWSSArea = true: Displays the Buy/Sell zones -
ShowHighLowOpen = true: Shows daily high, low, and open price -
ShowComment = true: Enables signal comments in the chart corner -
EmailAlert = false: Disables email alerts (can be turned on) -
SingleAlarm/NoisyAlarm: Choose between one-time or repeated audio alerts
These options allow users to customize how much data appears on-screen and tailor the layout to their preferences.
Role in the Strategy:
_WSS-Graphics acts as the user interface for the entire system. By combining real-time analysis, trade zones, alerts, and key levels in one panel, it simplifies the trading experience. Instead of checking multiple indicators separately, traders can make informed decisions directly from this dashboard.
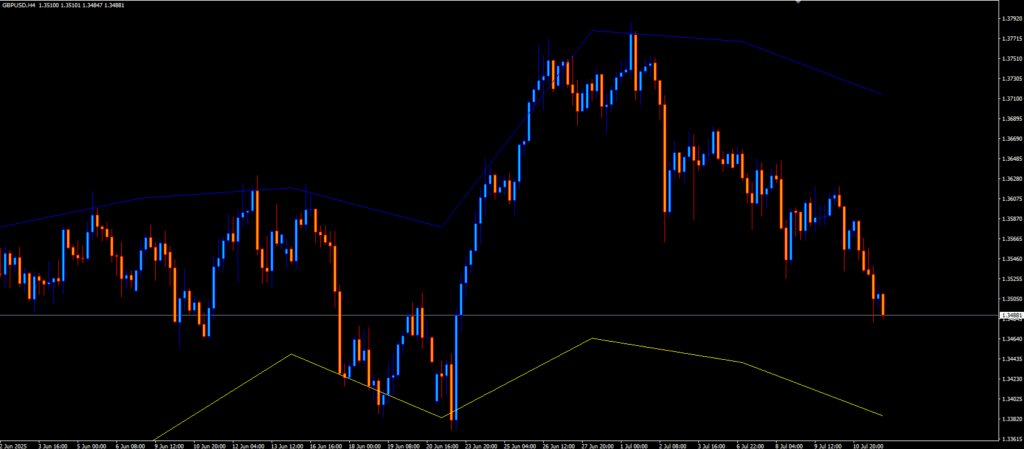
5. Din_Fibo_High
The Din_Fibo_High indicator is a complementary tool within the WSS_Platinum Forex Strategy. It automatically plots Fibonacci retracement levels based on recent price highs, providing dynamic zones for potential market reactions.
Default Settings:
-
Ch_period = 3: Analyzes the last 3 significant highs to define the main price wave -
Ratio = 0.786: Uses the 78.6% Fibonacci retracement level as a primary threshold -
Sett All Bars = False: Focuses only on the most recent valid market structure instead of scanning the full historical data
Visual Elements and Functionality:
-
Yellow and blue lines mark the high and low points that form the Fibonacci base
-
These levels update dynamically as market structure evolves
-
The space between the lines represents zones of potential support or resistance based on retracement logic
Role in the Strategy:
The Din_Fibo_High indicator helps traders:
-
Identify potential reversal areas based on recent price action
-
Set more precise Stop Loss and Take Profit levels
-
Align entries with Fibonacci-based zones confirmed by other system indicators
In the WSS_Platinum system, this tool plays a key role in detecting reactive zones and strengthens trade setups when combined with signal filters and trend indicators.
6. xMeterMTF
The xMeterMTF indicator serves as a complementary tool in the WSS_Platinum Forex Strategy. It is designed to measure the relative strength of individual currencies across multiple timeframes. This allows traders to choose the most favorable currency pairs based on real-time strength and weakness data.
Display Components:
-
Each vertical bar represents a currency (e.g., USD, EUR, GBP, CHF, etc.)
-
The height of the bar reflects the strength or weakness of that currency
-
Colours indicate the relative status:
-
Dark Green: Strong
-
Light Green or Yellow: Moderate
-
Orange and Red: Weak
-
-
Below each bar, a numeric value is displayed. These values quantify the internal strength score and support more accurate comparison and decision-making.
Role in Trading Decisions:
xMeterMTF is especially useful when selecting which currency pairs to trade.
For example, if CHF shows high strength while GBP shows weakness, a trader may focus on selling GBP/CHF, taking advantage of the divergence.
In the WSS_Platinum system, this indicator functions as a smart filter. It helps ensure that entries are only taken when clear strength and weakness imbalances exist between currencies.

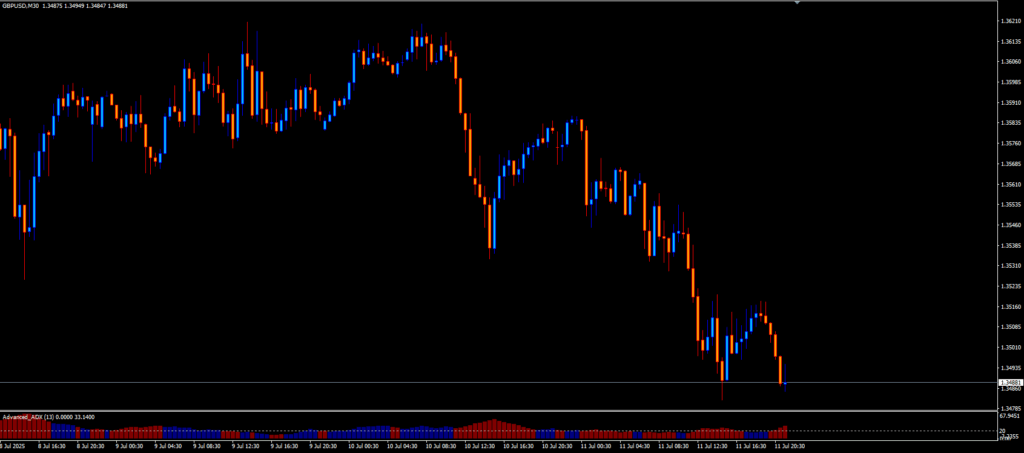
7. Advanced_ADX
The Advanced_ADX indicator is a key component of the WSS_Platinum Forex Strategy, used to measure the strength of market trends. It is an enhanced version of the standard ADX (Average Directional Index) and is set to a default period of 13 within this strategy.
How It Displays Data:
At the bottom of the chart, colored histograms provide a quick visual cue:
-
🔴 Red bars indicate increasing bearish trend strength
-
🔵 Blue bars reflect strengthening bullish momentum
-
Bar height represents trend strength—the taller the bar, the stronger the trend
In addition, a numeric ADX value appears in the lower-left corner of the chart.
This value quantifies the current trend strength.
For example, a reading above 30 typically suggests a strong and stable trend.
Role in the Strategy:
The Advanced_ADX indicator helps traders:
-
Avoid trading during weak or flat market conditions
-
Enter trades only when trend momentum is sufficiently strong
-
Anticipate potential exit points by observing increases or decreases in trend strength
While this indicator does not generate direct buy or sell signals, it plays a critical role as a trend strength filter. When combined with other components of the WSS_Platinum system, it improves trade quality by confirming strong momentum and filtering out low-probability setups.
Step-by-Step Guide to Using the WSS_Platinum Forex Strategy
WSS_Platinum is not just a combination of indicators; it is a complete trading system designed for analysis, decision-making, and risk management in the Forex market. Here’s a detailed step-by-step guide on how to use this strategy effectively:
Step 1: Analyse Overall Market Conditions
Begin by examining the #signal_Bar_V6 panel. This display shows the trend status across multiple timeframes (M1 to H4) for three key indicators:
-
MACD
-
EMA
-
Strength
🟩 If most blocks are green → Bullish trend
🟥 If most blocks are red → Bearish trend
Avoid trades when the signal colours are mixed or unclear.
Step 2: Confirm Trend Strength
Now check the Advanced_ADX indicator:
-
🔵 Tall blue bars → Strong bullish trend
-
🔴 Tall red bars → Strong bearish trend
-
⚪ Short, faded bars → Weak trend or ranging market (No trade)
Only trade when ADX confirms sufficient trend strength.
Step 3: Identify Key Zones and Market Levels
Using WSS-Graphics, locate the following:
-
Buy Area / Sell Area
-
Reversal Low / Reversal High
-
Daily Pivot, Yesterday’s High/Low
-
Overbought or No-Trade Warnings
Check for text-based trade suggestions like:
Strong Buy | Target Point = 1.3526
These give an early signal for potential entries.
Step 4: Choose the Right Currency Pair
Use xMeterMTF to identify the strongest and weakest currencies.
Example:
If USD = 5.8 and GBP = 1.8 → Focus on short positions in GBP/USD
This selection increases the probability of success by trading strong vs. weak.
Step 5: Analyse Price Structure
With Din_Fibo_High and BBANDS~1, study technical zones:
-
Is the price reacting near Fibonacci levels?
-
Are red/blue dots appearing in BBANDS~1?
-
Is the market showing squeeze or overbought/oversold behaviour?
Only enter when price action and technical zones align with the system signals.
Step 6: Manage the Trade Properly
Once in a trade:
-
Take Profit (TP): Use system suggestions or major chart levels (e.g., Reversal Points)
-
Stop Loss (SL): Place below/above the last signal candle or a strong support/resistance zone
-
Trailing Stop: Activate after 20 pips in profit (suggested: 15–20 pips)
Step 7: Follow the System Rules
WSS_Platinum has specific trading rules:
-
Maximum 1 buy and 1 sell trade per day
-
Trade only between 05:00 to 15:00 GMT (active sessions)
-
Avoid trading in low volatility or warning zones
Following these rules is essential to stay consistent with the system.
Risk Management Tips and Best Practices for WSS_Platinum
Even a strong strategy like WSS_Platinum requires proper discipline and risk control. Here are some best practices:
1. Prioritise Capital Management
-
Never risk more than 2% of your account balance per trade
-
Use tools like
MoneyRiskSettings to auto-calculate lot sizes
2. Don’t Rely on Single Indicators
WSS_Platinum is a multi-confirmation system. Always confirm:
-
Market direction
-
Trend strength
-
Proper entry zone
-
Trading within active hours
3. Avoid Emotional Trading
If you feel uncertain or emotional, skip the trade—even if signals are valid.
4. Trade Only During Optimal Hours
-
Best performance during the London & New York sessions
-
Avoid entries outside 05:00–15:00 GMT
5. Keep a Trading Journal
Log each trade with:
-
Entry time
-
Indicator confirmations
-
Reason for entry
-
Trade result
This helps identify mistakes and improve decision-making over time.
6. Practice on Demo First
Before going live, test the system for at least one month in a demo account.
7. Customise the Strategy Over Time
Once familiar, you can build a personalised version of this strategy.
📖 Don’t forget to read our guide on [How to Build a Personal Forex Strategy].
8. Use the Strategy for Copy Trading
If you want to automate this system or offer it to followers, you can use it in Copy Trading format.
📘 For details, check out our article: [What Is Copy Trading?].
🔍 Step 2: Entry Point Identification
-
The WSS-Graphics panel displayed a live message:
➡️ Sell Signal | Target: 1.35260 -
A red downward arrow also appeared on the chart, indicating a sell signal.
-
Price entered the Sell Area.
-
BBANDS~1 showed consecutive red dots, suggesting bearish pressure and overbought-to-sell conditions.
✅ Entry Executed:
Sell at 1.35750
🛡 Step 3: Take Profit & Stop Loss
-
Take Profit (TP): 1.35260 (as recommended by the WSS system)
-
Stop Loss (SL): 1.35980 (just above the signal candle and Sell Area zone)
🔄 Step 4: Trade Management
-
Price gradually moved downward after entry.
-
Within ~30 minutes, price broke below 1.35600.
-
A trailing stop was activated at 20 pips.
-
After roughly 2.5 hours, the trade hit the TP at 1.35260 and closed in profit.
📈 Final Profit: Approx. 49 pips
🗂 Step 5: Trading Journal Entry
This trade was fully recorded in the daily journal, including:
-
Entry date and time
-
Technical reasons for entry (indicator analysis and price structure)
-
Risk amount and position size
-
Final result and trader’s emotions at the time of execution
✍️ Not Using a Trading Journal Yet?
If you’re not sure how to write a professional trading journal, we highly recommend reading our guide:
👉 [Trading Journaling – A Step-by-Step Guide for Forex Traders]
This article helps you track performance, reduce mistakes, and improve your decision-making process.
🔍 Broker Selection Matters
Choosing the right broker is essential for consistent performance in Forex trading.
📌 To find the best broker for your needs, visit the Broker Reviews section on FastPip.com.
✅ Conclusion: Is WSS_Platinum Worth Using?
The WSS_Platinum trading strategy is far more than just a set of indicators — it’s a complete system for market analysis, decision-making, and risk management. Its structure enables traders to:
-
Analyze trends across multiple timeframes
-
Combine technical confirmation with timing filters
-
Execute trades based on clearly defined zones and signals
-
Manage trades using trailing stop and market context
-
Maintain discipline through strict entry conditions and journaling
Whether you are an intermediate trader or aiming to professionalize your approach, WSS_Platinum offers a balanced combination of simplicity and precision. With proper use and risk control, it can become a powerful asset in your trading toolkit.
🔁 Still struggling to apply it on your own? You can also mirror our trades using our copy trading solution based on the WSS_Platinum strategy. [Learn more about Copy Trading here.]
📚 Further Reading
If you’re new to some of the technical indicators used in this strategy, we recommend reading this guide on the ADX indicator from Investopedia to better understand how it helps identify trend strength.
[What Is the Average Directional Index (ADX)?]