
Silver Intraday Forecast: Upside Toward 66.49 and 67.14 While 64.04 Holds
Introduction
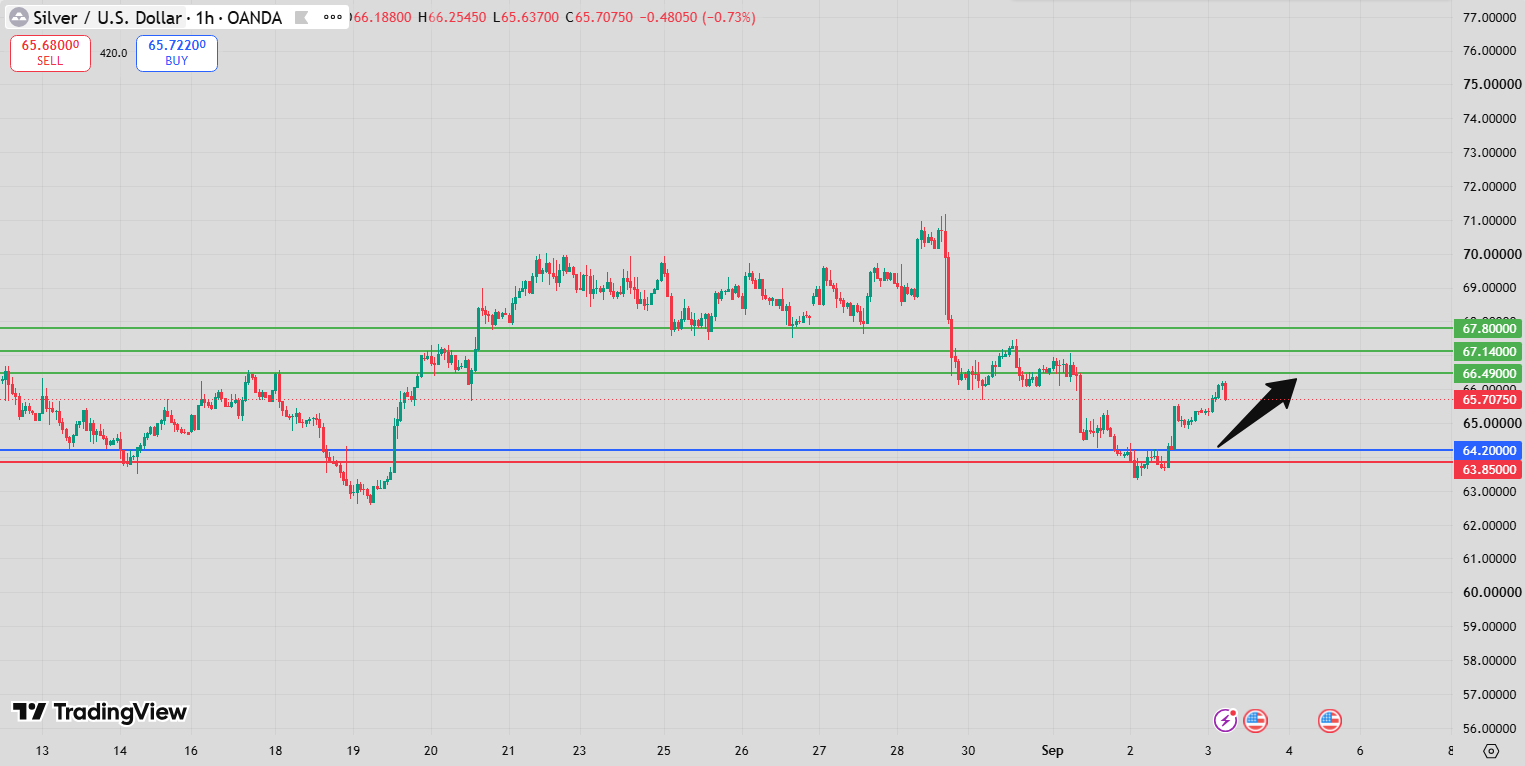
The Silver Intraday Forecast favors further upside as long as the key support level at 64.04 continues to hold. The current setup identifies 64.04 as an important potential turning point, with the bullish scenario targeting 66.49 and 67.14.
The chart structure suggests that silver has been coiling ahead of a potentially significant move. Such a structure can precede an expansion in volatility, making the reaction around the pivot particularly important for intraday traders.
The preferred scenario remains bullish while 64.04 acts as support. If buyers successfully defend this level, silver could move toward 66.49 and potentially extend the advance toward 67.14.
However, a decisive break below 64.04 would weaken the bullish structure and activate the alternative bearish scenario. In that case, attention would shift toward 62.95, followed by 62.31.
For traders, the key question is therefore whether silver can maintain 64.04 as support and use this level as a launching point for the next upside move.
Silver Intraday Forecast Technical Analysis
The Silver Intraday Forecast currently favors the upside while 64.04 remains intact as support.
The primary technical path is:
Above 64.04 → 66.49 → 67.14
The pivot at 64.04 represents the central level for the current setup. As long as price remains above this area, the short-term structure favors buyers.
The chart is also described as coiling, meaning price action is becoming increasingly compressed ahead of a potentially significant directional move. When such compression develops near an important support level, a successful defense of that level can create the conditions for a stronger breakout.
If buyers maintain control above 64.04, the first major upside objective is 66.49. A sustained move beyond this level could then open the way toward 67.14.
The bullish scenario would become less reliable if price loses 64.04 decisively.
Silver Intraday Forecast Market Sentiment Analysis
The Silver Intraday Forecast reflects a market approaching an important decision point.
The coiling structure indicates that neither buyers nor sellers have yet generated a decisive breakout. This compression can create a setup in which the eventual move becomes significantly stronger once one side gains control.
At present, the technical bias favors buyers because 64.04 is acting as support. As long as this level remains defended, market sentiment can gradually shift toward expectations of an upside breakout.
A successful move toward 66.49 would strengthen the bullish sentiment, while a continuation above that level could bring 67.14 into focus.
On the other hand, a decisive break below 64.04 would change the short-term balance and could increase selling pressure toward 62.95 and 62.31.
Key factors for the current sentiment include:
- Price reaction around 64.04
- Strength of the potential upside breakout
- Volatility expansion after the current consolidation
- Momentum generated above resistance
- Broader precious-metal market sentiment
- US dollar movements
- Treasury yield expectations
- Global risk sentiment
The immediate technical reaction at 64.04 remains the most important factor for this intraday setup.
Silver Intraday Forecast Support and Resistance Levels
The key levels in today’s Silver Intraday Forecast are centered around the 64.04 pivot.
Key Support: 64.04
The main support level is:
64.04
As long as silver holds above this level, the bullish scenario remains preferred.
First Upside Target: 66.49
The primary bullish objective is:
66.49
A move toward this level would represent the first major upside target from the current setup.
Second Upside Target: 67.14
If buyers maintain momentum above 66.49, the next objective becomes:
67.14
This represents the second major bullish target.
Alternative Downside Target: 62.95
A decisive break below 64.04 would activate the bearish alternative, with:
62.95
as the first downside objective.
Second Alternative Downside Target: 62.31
If selling pressure continues below 62.95, silver could extend the decline toward:
62.31
Therefore, the key levels are:
- Pivot / Support: 64.04
- Target A: 66.49
- Target B: 67.14
- Alternative Target A: 62.95
- Alternative Target B: 62.31
Silver Intraday Forecast Trading Scenario Analysis
According to the Silver Intraday Forecast, the preferred scenario is bullish while 64.04 remains support.
Bullish Scenario
If silver continues to hold above 64.04, buyers are expected to maintain the short-term advantage.
The first upside objective is 66.49. If buyers manage to break and sustain price above this level, the next target becomes 67.14.
The primary bullish path is therefore:
64.04 support → 66.49 → 67.14
The coiling structure could make the eventual breakout more significant if sufficient buying momentum develops.
Potential Turning Point Scenario
The current setup describes 64.04 as a potential turning point.
A strong reaction from this level could indicate that sellers are losing control and that buyers are preparing for a broader intraday recovery.
If the market repeatedly tests 64.04 but continues to hold above it, the level could become increasingly important as a base for an upside move.
However, traders should distinguish between a temporary bounce and a confirmed bullish continuation. A stronger confirmation would come from sustained price action above the relevant upside levels.
Bearish Alternative Scenario
The bullish outlook would weaken if silver breaks decisively below 64.04.
In that situation, the alternative scenario becomes active, with 62.95 as the first downside target and 62.31 as the second.
The alternative path is therefore:
Below 64.04 → 62.95 → 62.31
A sustained move below the pivot would indicate that the expected bullish reversal has failed and sellers have regained short-term control.
Silver Intraday Forecast Risk Factors and Alternative Outlook
The primary risk to the Silver Intraday Forecast is a decisive breakdown below 64.04.
Because the chart structure is currently coiling, the eventual breakout could generate increased volatility in either direction. A false breakout around the pivot could also create rapid reversals before the market establishes a clear trend.
If buyers fail to defend 64.04, the bullish scenario toward 66.49 and 67.14 would lose validity. The market could then move toward 62.95 and potentially 62.31.
Other factors that could influence silver include:
- US dollar fluctuations
- Treasury yield movements
- Federal Reserve expectations
- Precious-metal positioning
- Global economic uncertainty
- Safe-haven demand
- Commodity market volatility
- Changes in investor risk appetite
The key technical protection for the bullish outlook remains 64.04.
Silver Intraday Forecast Conclusion
The Silver Intraday Forecast favors further upside as long as 64.04 continues to hold as support.
The primary upside targets are 66.49 and 67.14. The current coiling chart structure suggests that silver may be preparing for a potentially significant move, making the reaction around the 64.04 pivot particularly important.
A successful defense of 64.04 could provide the foundation for an upside breakout toward 66.49. If buyers maintain momentum beyond that level, 67.14 becomes the next major objective.
Conversely, a decisive break below 64.04 would invalidate the preferred bullish scenario and expose 62.95, followed by 62.31.
Overall, 64.04 remains the key level for the current intraday setup. Above it, the bullish path toward 66.49 and 67.14 remains preferred. Below it, the outlook shifts toward 62.95 and 62.31.
FAQ
What is the current Silver Intraday Forecast?
The Silver Intraday Forecast favors the upside while silver remains above 64.04, with 66.49 and 67.14 as the main targets.
Why is 64.04 important?
The 64.04 level is the key pivot and support. Holding above it keeps the bullish scenario active, while a decisive break below it could trigger further downside.
What are the upside targets for silver?
The first upside target is 66.49, followed by 67.14 if bullish momentum continues.
What happens if silver breaks below 64.04?
A break below the pivot would activate the alternative bearish scenario, with 62.95 and 62.31 as downside targets.
What does the coiling chart structure mean?
The coiling structure suggests that price action is becoming compressed ahead of a potentially significant move. A breakout from this structure could lead to increased volatility and a stronger directional move.

