
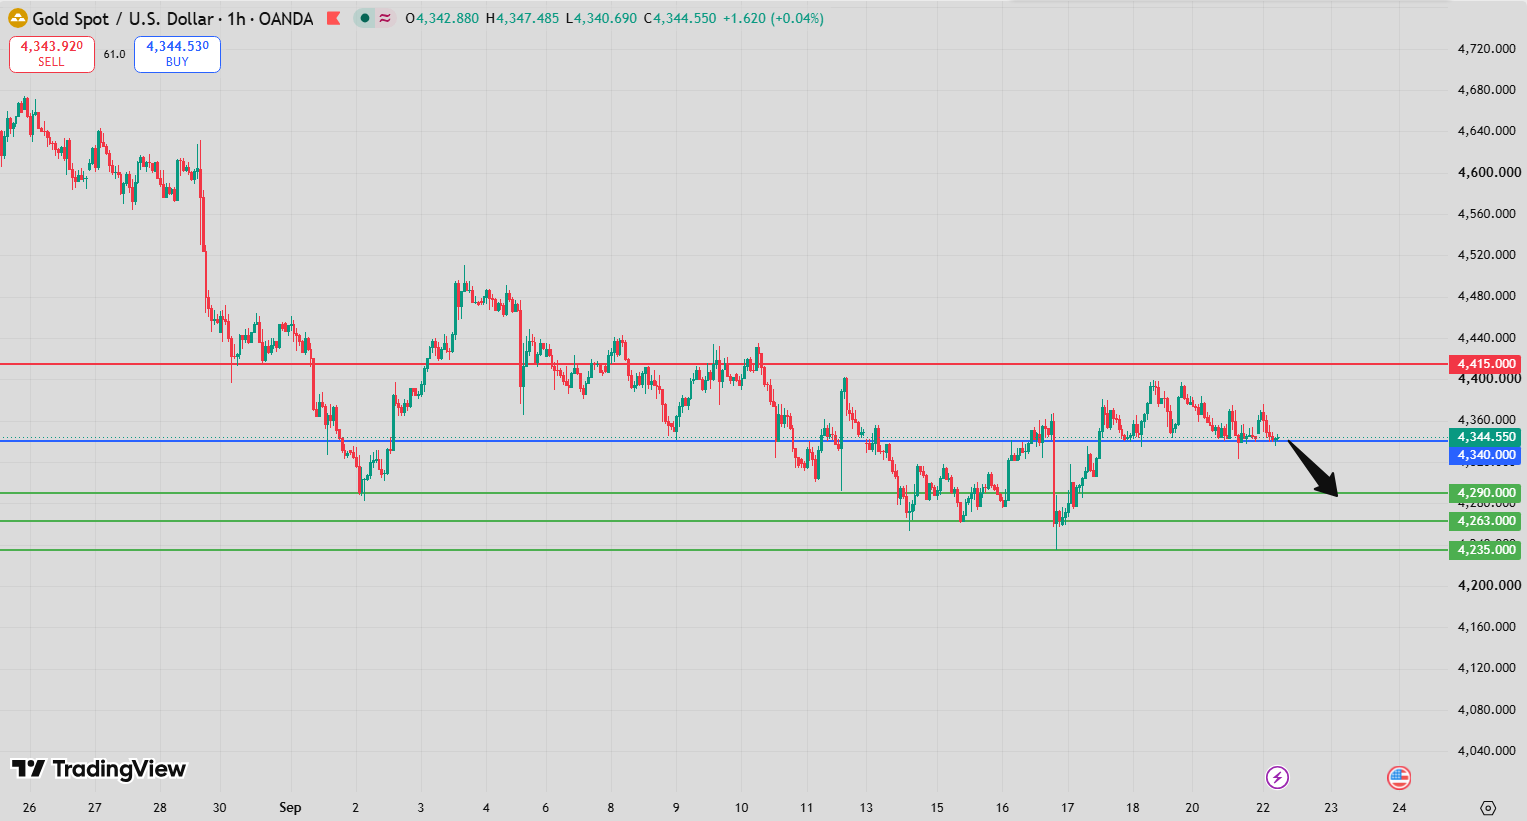
Gold Intraday Forecast: Downside Toward 4,290 and 4,263 While 4,391 Holds
Introduction
The Gold Intraday Forecast remains bearish as long as 4,391 continues to act as resistance. The current setup favors further downside, with 4,290 and 4,263 identified as the primary targets while sellers maintain control below the pivot.
The technical configuration also supports the bearish outlook. The RSI is below its neutrality level of 50, while the MACD remains below its signal line and in negative territory. Gold is also trading below both its 20-period and 50-period moving averages, reinforcing the current downside structure.
Gold Intraday Forecast Technical Analysis
The key technical threshold in the current setup is 4,391. As long as Gold remains below this pivot resistance, the prevailing short-term structure continues to favor sellers.
The moving-average configuration provides additional confirmation. Gold is trading below the 20-period moving average at 4,350 and the 50-period moving average at 4,351. The close positioning of these two averages also creates a relatively clear dynamic resistance area beneath the main 4,391 pivot.
Momentum indicators remain negative as well. The RSI below 50 indicates that bullish momentum has not regained control, while the MACD below its signal line and in negative territory supports the continuation of downside pressure.
If sellers maintain control below 4,391, the first major objective is 4,290, followed by 4,263 if bearish momentum extends.
Gold Intraday Forecast Market Sentiment Analysis
Short-term sentiment remains negative while Gold trades below 4,391. The combination of weak momentum indicators and price positioning below both moving averages suggests that sellers currently retain the technical advantage.
The RSI remaining below 50 indicates that the market has not returned to a bullish momentum regime. At the same time, the negative MACD configuration provides additional evidence that downside pressure remains present.
However, the bearish structure would be challenged if Gold manages to reclaim 4,391. A sustained breakout above this pivot could shift short-term attention toward 4,437 and 4,464.
Gold Intraday Forecast Support and Resistance Levels
Key Pivot Resistance: 4,391
The 4,391 level is the central pivot and resistance in the current Gold Intraday Forecast. Remaining below this threshold keeps the bearish scenario active.
First Downside Target: 4,290
Target A: 4,290
The first major downside objective is 4,290. This level should be monitored for signs of stabilization, profit-taking or a temporary rebound.
Second Downside Target: 4,263
Target B: 4,263
If selling pressure remains strong after the move toward 4,290, Gold could extend its decline toward 4,263, the second major downside objective.
Alternative Upside Targets
A sustained break above 4,391 would shift the focus toward:
- 4,437 – First alternative upside target
- 4,464 – Second alternative upside target
Key Levels to Watch
- 4,391: Main pivot and resistance
- 4,290: Target A / first downside objective
- 4,263: Target B / second downside objective
- 4,350: 20-period moving average
- 4,351: 50-period moving average
- 4,437: Alternative upside target
- 4,464: Extended upside target
Gold Intraday Forecast Trading Scenario Analysis
Bearish Scenario
The primary scenario remains bearish while 4,391 holds as resistance. Continued rejection below this level would keep sellers in control and place 4,290 in focus.
A decisive break below 4,290 could then accelerate the decline toward 4,263. The negative RSI and MACD configuration supports this continuation scenario, provided that momentum remains weak.
Momentum Continuation Scenario
The current indicator configuration is consistent with bearish continuation. RSI remains below 50, MACD is below its signal line and negative, while Gold remains below both the 20-period and 50-period moving averages.
If these conditions persist while 4,391 caps the upside, the downside structure remains intact and the two stated targets stay in focus.
Reversal Scenario
A sustained move above 4,391 would weaken the immediate bearish setup. If buyers can establish price above the pivot, Gold could advance toward 4,437, followed by 4,464.
For a more convincing reversal, improvement in momentum alongside the price breakout would provide additional confirmation.
Gold Intraday Forecast Risk Factors and Alternative Outlook
The main risk to the bearish outlook is a sustained bullish breakout above 4,391. Such a move would challenge the current resistance structure and potentially trigger a short-term recovery.
Another risk is a recovery in momentum before the downside targets are reached. If RSI moves back above 50 or the MACD begins to improve, selling pressure could weaken.
On the downside, 4,290 and 4,263 may attract profit-taking or short-term buying activity. Price behavior around each target should therefore be monitored carefully rather than assuming uninterrupted downside movement.
Gold Intraday Forecast Conclusion
The Gold Intraday Forecast remains bearish below 4,391, with 4,290 as Target A and 4,263 as Target B. The bearish configuration is supported by RSI below 50, MACD below its signal line and negative, and Gold trading below both the 20-period and 50-period moving averages.
As long as 4,391 remains resistance, the downside scenario stays active. A decisive break below 4,290 could accelerate the move toward 4,263, while a sustained breakout above 4,391 would weaken the immediate bearish structure and expose 4,437 and 4,464.
FAQ
What is the key resistance level in the Gold Intraday Forecast?
The key resistance and pivot is 4,391.
What is the first downside target for Gold?
The first downside target is 4,290, identified as Target A.
What is the second downside target?
The second downside target is 4,263, identified as Target B.
What do the RSI and MACD indicate?
The RSI is below 50, while the MACD is below its signal line and negative. Both indicators currently support the bearish technical configuration.
What are the alternative upside targets?
If Gold breaks and sustains trading above 4,391, the alternative targets are 4,437 and 4,464.

