
Gold Intraday Forecast: Bearish Pressure Below 4,333
Introduction
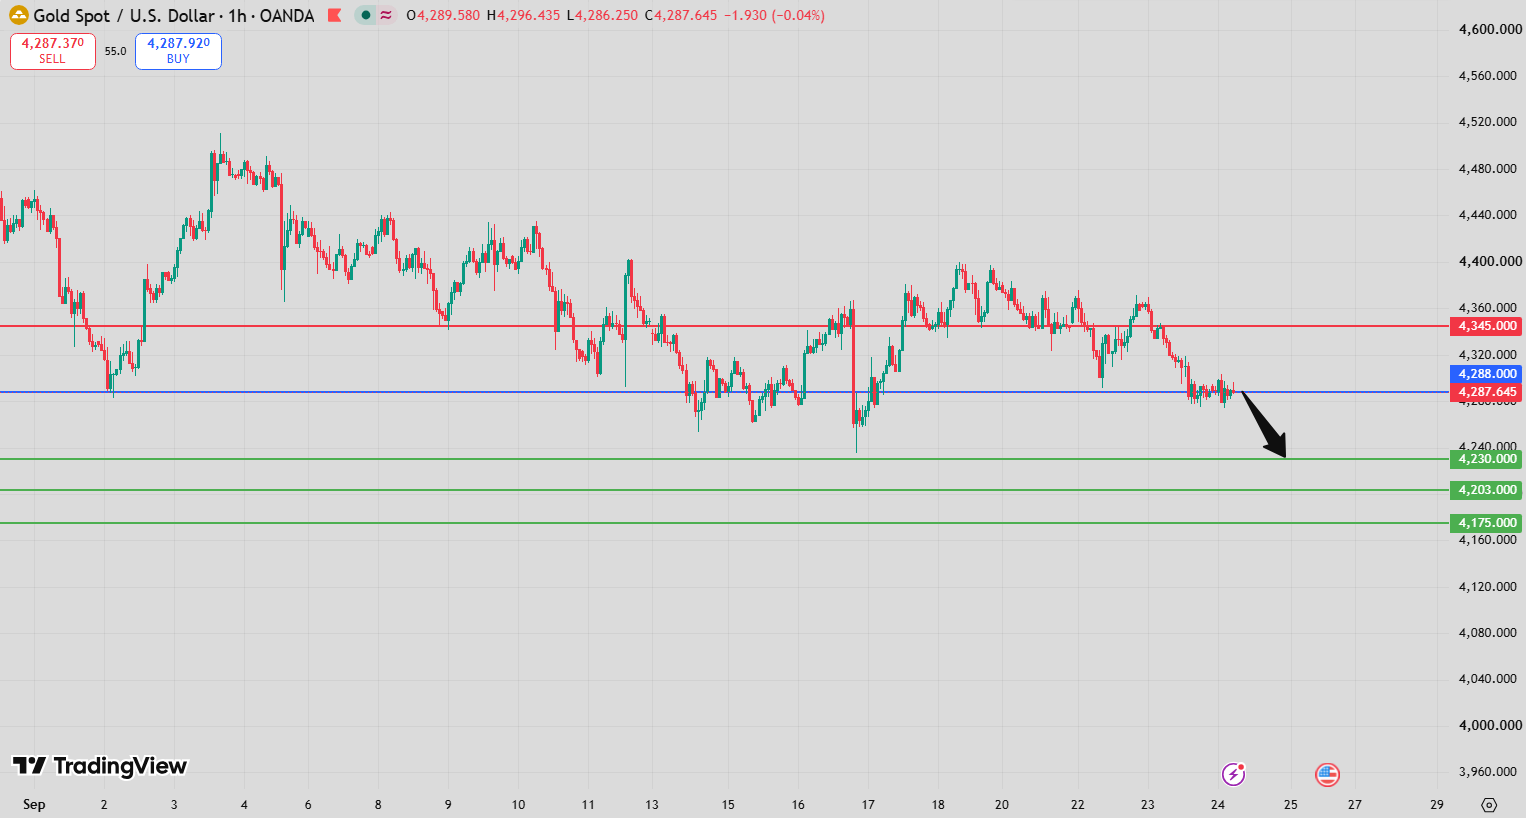
The latest Gold Intraday Forecast points to continued downside pressure as long as the 4,333 resistance level remains intact. The current technical structure suggests that sellers retain control, with 4,230 and 4,203 identified as the main downside targets.
Momentum indicators also provide a cautious bearish backdrop. The RSI remains below its neutral 50 area, while the MACD is negative despite trading above its signal line. At the same time, gold is positioned above its 20-period moving average at 4,288, but remains below the 50-period moving average at 4,301, creating a mixed short-term structure with a bearish directional bias below the key pivot.
Gold Intraday Forecast Technical Analysis
The technical picture remains bearish while gold trades below 4,333. This level is currently the key pivot and acts as the main threshold between the bearish and alternative bullish scenarios.
Price action around the moving averages is particularly important. Gold is trading above the 20-period moving average at 4,288, which indicates that some short-term buying interest remains present. However, the price is still below the 50-period moving average at 4,301, meaning the broader intraday momentum has not fully shifted back to the upside.
The RSI is below 50, showing that bearish momentum remains stronger than bullish momentum from a relative-strength perspective. Meanwhile, the MACD remains in negative territory, although it is above its signal line. This combination suggests that downside pressure remains relevant, but the market could experience short-term rebounds or consolidation before another directional move.
Therefore, the most important technical condition is whether gold can reclaim and hold above 4,333. Failure to do so keeps the downside scenario active.
Gold Intraday Forecast Market Sentiment Analysis
Market sentiment remains cautious toward gold in the short term. The inability to establish a sustained move above 4,333 leaves sellers with an important technical advantage.
The RSI below 50 supports this interpretation, while the negative MACD indicates that the broader momentum structure has not completely turned bullish. However, the MACD being above its signal line and the price remaining above the 20-period moving average indicate that the bearish trend is not completely one-directional.
This means traders should distinguish between a temporary rebound and a genuine trend reversal. A recovery toward the 4,301–4,333 zone could attract selling interest if buyers fail to establish a sustained breakout above resistance.
Gold Intraday Forecast Support and Resistance Levels
Key Pivot Resistance: 4,333
The 4,333 level is the primary resistance and pivot for the current setup. As long as price remains below this level, the downside scenario remains technically valid.
A sustained break above 4,333 would weaken the bearish structure and shift attention toward the alternative upside levels.
First Downside Target: 4,230
The first major downside objective is 4,230. This is the primary bearish target and the first level traders should monitor if selling pressure accelerates below the current structure.
A move toward 4,230 would indicate that sellers have successfully extended the bearish move from the resistance zone.
Second Downside Target: 4,203
The second main target is 4,203. If gold breaks below 4,230 and selling momentum remains strong, this level becomes the next important downside objective.
Alternative Upside Target: 4,378
If gold breaks above 4,333, the bearish setup would lose validity and the market could move toward 4,378.
Extended Alternative Upside Target: 4,404
A sustained bullish breakout above 4,378 could expose 4,404 as the next upside objective.
Key Levels
- Resistance / Pivot: 4,333
- First Downside Target: 4,230
- Second Downside Target: 4,203
- Alternative Upside Target: 4,378
- Extended Upside Target: 4,404
- 20-Period Moving Average: 4,288
- 50-Period Moving Average: 4,301
Gold Intraday Forecast Trading Scenario Analysis
Bearish Scenario
The primary scenario remains bearish while 4,333 acts as resistance. Failure to break and hold above this level can keep selling pressure active and open the path toward 4,230.
If sellers successfully push gold below 4,230, the next major objective becomes 4,203. Momentum confirmation would become stronger if the RSI remains below 50 while price continues trading beneath the key resistance structure.
Pullback Scenario
A short-term recovery toward the 4,288–4,301 moving-average zone should not automatically be interpreted as a bullish reversal. This area may function as an intermediate test of buying strength.
If gold rebounds toward 4,301 but fails to reclaim 4,333, sellers could regain control and attempt another move toward 4,230.
Bullish Alternative Scenario
The bearish outlook would be challenged if gold breaks decisively above 4,333. In that case, the market could shift toward 4,378, followed by 4,404 if bullish momentum persists.
The key distinction is whether the move above 4,333 is sustained or merely a temporary breakout. A failed breakout could quickly return gold to the bearish range.
Gold Intraday Forecast Risk Factors and Alternative Outlook
The main risk to the bearish scenario is a sustained recovery above 4,333. Such a move would invalidate the primary downside structure and increase the probability of a move toward 4,378 and 4,404.
Another risk comes from the mixed momentum signals. Although the RSI is below 50 and the MACD remains negative, the MACD is above its signal line and price is above the 20-period moving average. These factors increase the possibility of short-term rebounds and make confirmation important before assuming that every upward move is only a correction.
Traders should also monitor how price behaves around 4,288 and 4,301. A sustained move above both moving averages would improve short-term bullish momentum, while rejection from this area would keep the bearish structure intact.
Gold Intraday Forecast Conclusion
The current Gold Intraday Forecast remains bearish below 4,333. The key downside objectives are 4,230 and 4,203, while a sustained breakout above 4,333 would shift the market toward the alternative targets at 4,378 and 4,404.
Technically, the RSI below 50 and negative MACD support the bearish bias, although the MACD’s position above its signal line and gold’s location above the 20-period moving average indicate that short-term rebounds remain possible.
For the current setup, 4,333 is the critical level. Below it, sellers retain the directional advantage; above it, the technical scenario changes.
FAQ
What is the current Gold Intraday Forecast?
The current Gold Intraday Forecast is bearish while gold remains below the 4,333 resistance level.
What is the first downside target for gold?
The first downside target is 4,230.
What is the second downside target?
If selling pressure continues below 4,230, the next target is 4,203.
What happens if gold breaks above 4,333?
A sustained break above 4,333 would invalidate the primary bearish scenario and expose 4,378, followed by 4,404.
What do the RSI and MACD indicate?
The RSI is below its neutral 50 area, while the MACD remains negative but is above its signal line. This indicates bearish underlying momentum with the possibility of short-term recovery.

