
GBP/USD Intraday Forecast: Bearish Outlook Below 1.3263
Introduction
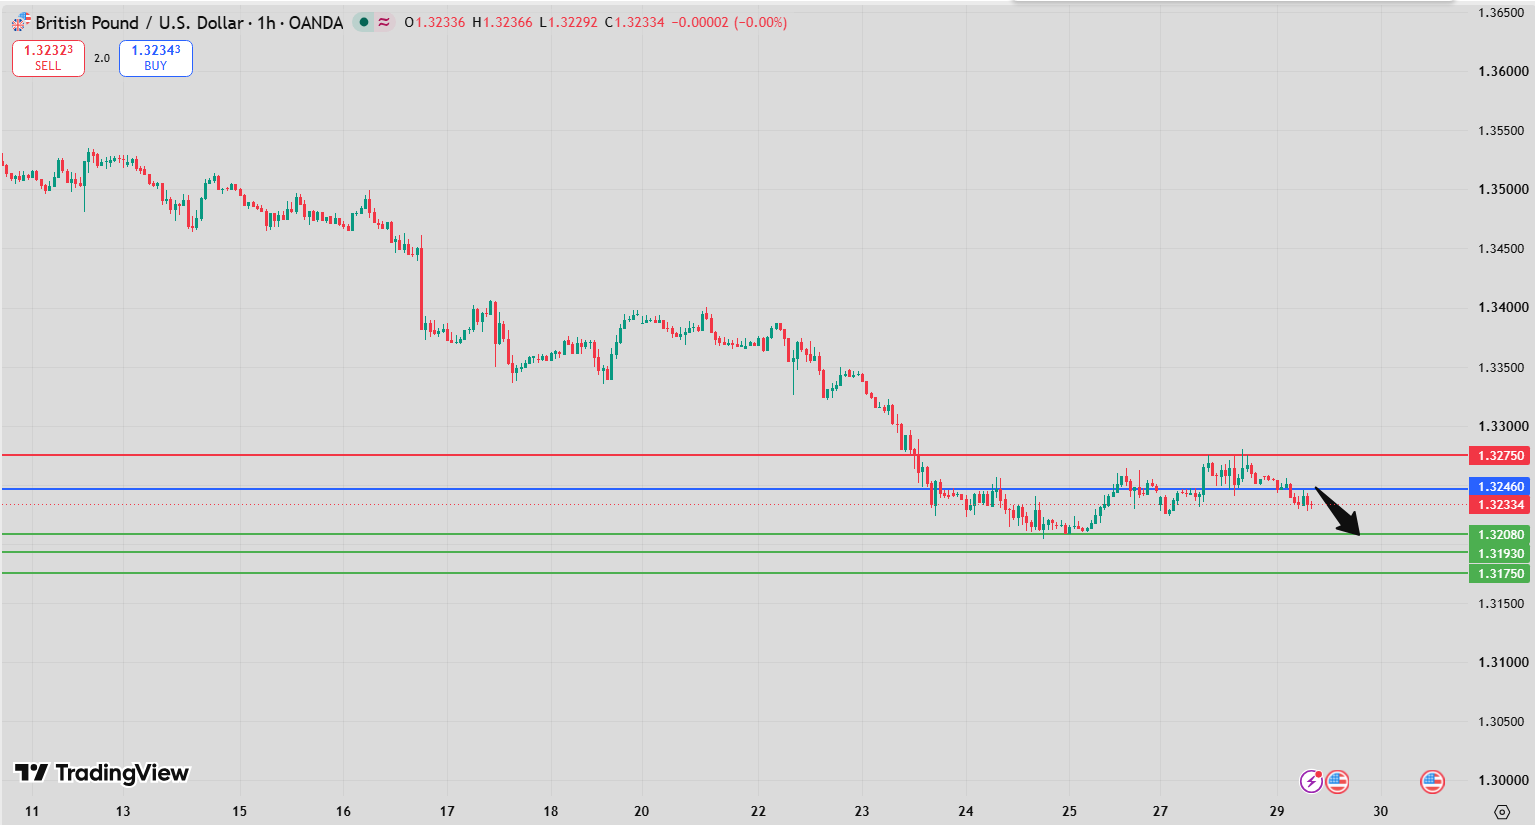
The GBP/USD Intraday Forecast remains bearish as long as the 1.3263 resistance level continues to cap upside attempts. The current setup favors further downside toward 1.3208, followed by 1.3193 if selling pressure remains sustained.
The technical picture supports this bearish scenario. Momentum indicators remain below their neutral levels, while the price is trading beneath both the 20-period and 50-period moving averages. This combination suggests that sellers currently retain control of the short-term structure, with 1.3263 acting as the key level that would need to be broken to invalidate the immediate bearish bias.
GBP/USD Intraday Forecast Technical Analysis
GBP/USD is showing a clear short-term bearish structure below the 1.3263 pivot. The pair is currently trading beneath both its 20-period moving average at 1.3246 and its 50-period moving average at 1.3254. This positioning indicates that the recent price action remains under pressure and that attempts to recover toward the moving-average cluster may encounter renewed selling.
Momentum indicators reinforce this interpretation. The RSI is below the 50 neutrality threshold, indicating that bullish momentum has not regained control. At the same time, the MACD remains below its signal line and in negative territory, providing additional evidence that downside momentum is still active.
The moving-average structure is particularly important because both averages are positioned below the 1.3263 resistance area. As a result, the region around 1.3246–1.3254 can act as an intermediate recovery barrier before the market reaches the major pivot at 1.3263.
A sustained failure to reclaim these levels would keep the short-term structure tilted toward the downside and increase the probability of another test of lower support areas.
GBP/USD Intraday Forecast Market Sentiment Analysis
Market sentiment in the current technical setup is predominantly defensive toward GBP/USD. The pair is trading below its key short-term moving averages, while both RSI and MACD point to weaker momentum. These conditions suggest that buyers have yet to establish sufficient strength to challenge the 1.3263 resistance.
The most important feature is the alignment between price and momentum. A bearish RSI reading alone does not necessarily guarantee continuation, but when it occurs alongside a negative MACD and price below both moving averages, the broader short-term setup becomes more consistent with continued selling pressure.
For traders monitoring the GBP/USD Intraday Forecast, 1.3263 therefore remains the central decision point. Below this level, rallies can continue to be treated as potential corrective moves within the prevailing bearish structure. A decisive move above 1.3263 would instead indicate that the current downside setup is losing strength.
GBP/USD Intraday Forecast Support and Resistance Levels
Key Pivot Resistance: 1.3263
The 1.3263 level is the primary resistance and pivot for the current setup. As long as GBP/USD remains below it, the bearish scenario remains active.
First Downside Target: 1.3208
The first objective is 1.3208. This is the initial downside target specified by the setup and represents the first major level where sellers may encounter profit-taking or a temporary rebound.
Second Downside Target: 1.3193
If selling pressure continues after 1.3208 is broken, the next target is 1.3193. A sustained move toward this level would confirm deeper downside continuation within the current intraday structure.
Alternative Upside Target: 1.3288
A break above 1.3263 would weaken the immediate bearish structure and expose 1.3288 as the first upside objective.
Secondary Upside Target: 1.3303
If GBP/USD establishes itself above 1.3288, the next upside level to monitor would be 1.3303.
Key Levels
- Resistance / Pivot: 1.3263
- 20-period MA: 1.3246
- 50-period MA: 1.3254
- First Downside Target: 1.3208
- Second Downside Target: 1.3193
- Alternative Upside Target: 1.3288
- Secondary Upside Target: 1.3303
GBP/USD Intraday Forecast Trading Scenario Analysis
Bearish Scenario
The primary scenario remains bearish while 1.3263 acts as resistance. Failure to break this level would keep selling pressure active and could push GBP/USD toward the first target at 1.3208.
If sellers successfully extend the move below 1.3208, attention would shift toward 1.3193. The negative MACD, RSI below 50, and price below both moving averages provide technical confirmation for this downside scenario.
Pullback Scenario
A recovery toward the 1.3246–1.3254 moving-average zone could occur before another attempt lower. Such a rebound would not necessarily invalidate the bearish structure as long as the pair remains below 1.3263.
This area should therefore be monitored carefully for signs of rejection. A failure to reclaim the moving averages could create another selling opportunity within the prevailing intraday structure.
Bullish Alternative Scenario
The bearish setup would lose strength if GBP/USD breaks and sustains above 1.3263. In that case, the pair could move toward 1.3288, followed by 1.3303 if bullish momentum accelerates.
A move above 1.3263 would be particularly important because it would represent a recovery through the main resistance level and invalidate the immediate downside preference.
GBP/USD Intraday Forecast Risk Factors and Alternative Outlook
The primary risk to the bearish outlook is a decisive breakout above 1.3263. Such a move could trigger short covering and attract fresh buyers, potentially accelerating the recovery toward 1.3288 and 1.3303.
Another risk is a temporary oversold reaction after the pair approaches 1.3208. Even within a bearish trend, the first target can produce profit-taking and short-term rebounds. Traders should therefore distinguish between a temporary pullback and a genuine reversal.
The technical indicators also need to be monitored dynamically. If RSI moves back above 50, MACD crosses above its signal line, and price recovers the moving-average cluster, the bearish momentum would weaken. Conversely, continued trading below the moving averages would keep the downside structure intact.
GBP/USD Intraday Forecast Conclusion
The GBP/USD Intraday Forecast remains bearish below 1.3263, with the technical structure favoring further downside. RSI remains below 50, MACD is negative and below its signal line, and price is positioned beneath both the 20-period and 50-period moving averages.
The primary downside objective is 1.3208, followed by 1.3193 if sellers maintain control. On the opposite side, a decisive break above 1.3263 would shift attention toward 1.3288 and 1.3303.
For the current setup, 1.3263 remains the key level separating the bearish scenario from the alternative bullish outlook.
FAQ
What is the main resistance for GBP/USD?
The main resistance and pivot level is 1.3263. The bearish scenario remains valid while the pair trades below this level.
What is the first target for GBP/USD?
The first downside target is 1.3208, followed by the second target at 1.3193.
What happens if GBP/USD breaks above 1.3263?
A sustained break above 1.3263 would weaken the bearish setup and could open the way toward 1.3288 and 1.3303.
What do the RSI and MACD indicate?
The RSI is below its 50 neutrality level, while the MACD is below its signal line and negative. Together, these readings indicate weaker short-term momentum.
Why are the moving averages important?
GBP/USD is trading below its 20-period moving average at 1.3246 and its 50-period moving average at 1.3254. These levels can act as intermediate resistance during short-term rebounds.

