
AUD/USD Intraday Forecast: Throwback or Further Upside Above 0.6939
Introduction
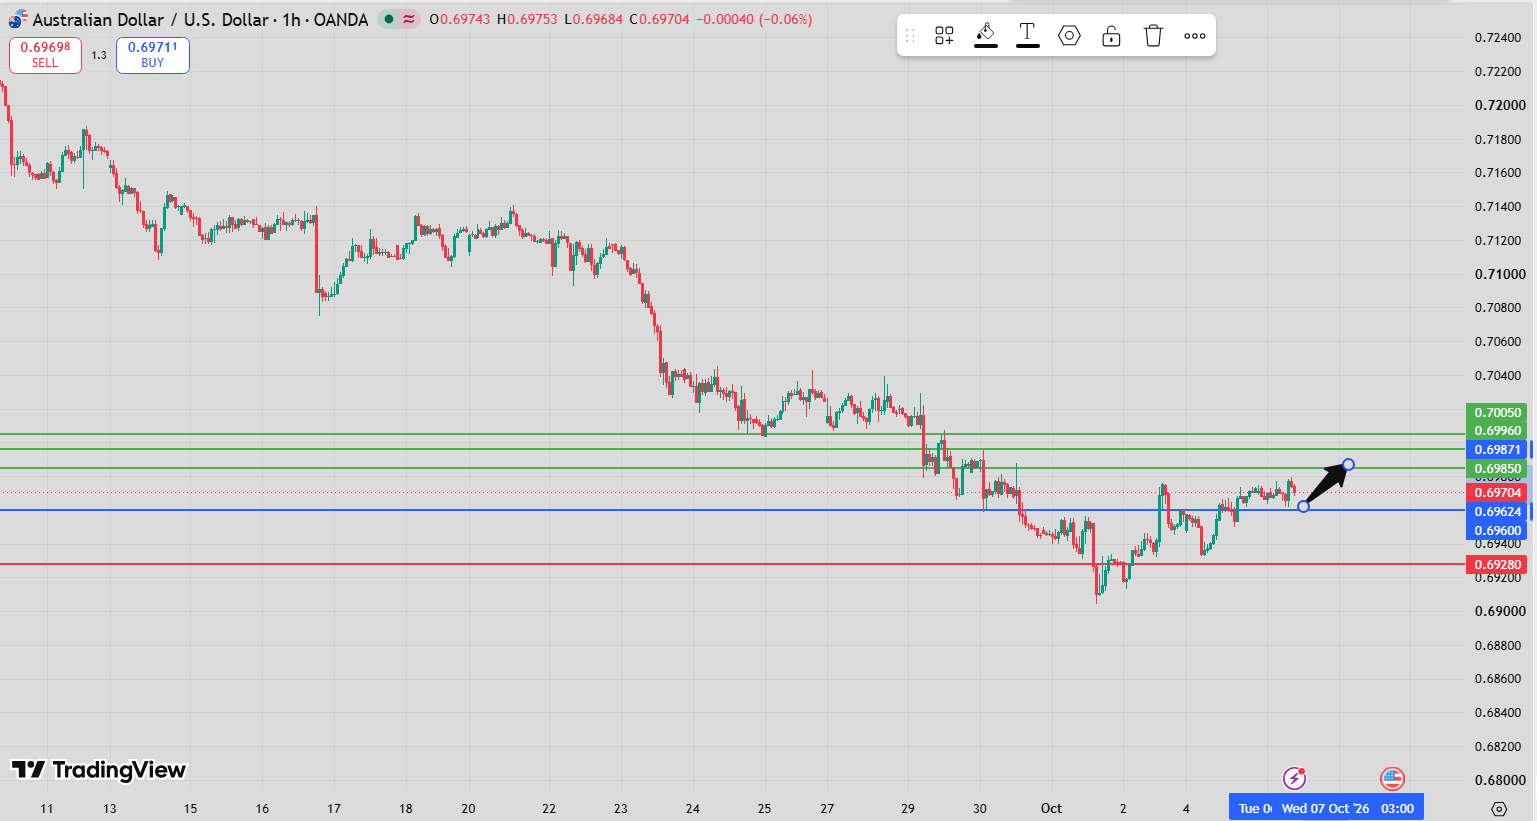
The AUD/USD Intraday Forecast remains bullish while 0.6939 continues to act as support. The current setup favors further upside, with 0.6985 and 0.6996 identified as the primary targets. However, as price is now within reach of the first target, the market could enter a temporary consolidation or throwback before attempting another move higher.
The proximity of AUD/USD to 0.6985 makes the next reaction particularly important. A controlled pullback that remains above 0.6939 would not invalidate the bullish structure and could provide the market with room to build fresh upside momentum. Conversely, a clear break above 0.6985 could sustain the upward move and increase the probability of reaching 0.6996.
The alternative scenario becomes active if the pair breaks below 0.6939. In that case, the bullish setup would weaken and attention would shift toward 0.6921 and 0.6911.
AUD/USD Intraday Forecast Technical Analysis
From a technical perspective, 0.6939 is the key pivot and support level controlling the current intraday structure. The bullish preference remains valid while price holds above this threshold, keeping buyers in control of the prevailing directional bias.
The first major upside objective is 0.6985. Because price is already approaching this level, the market may encounter temporary resistance and consolidation. Traders should therefore distinguish between a normal throwback and a genuine reversal.
A pullback from 0.6985 would remain compatible with the bullish structure as long as the market continues to hold above 0.6939. Such a reaction could allow buyers to absorb profit-taking before attempting another push higher.
On the other hand, a clear and sustained break above 0.6985 would provide stronger confirmation of the bullish continuation scenario. In that case, the next target becomes 0.6996, extending the current upside structure.
The technical picture therefore revolves around two important levels: 0.6939 defines the bullish invalidation area, while 0.6985 represents the immediate upside threshold that could determine whether the advance consolidates or accelerates.
AUD/USD Intraday Forecast Market Sentiment Analysis
Market sentiment remains bullish while AUD/USD trades above 0.6939. The current structure suggests that buyers retain control, although the pair’s proximity to the first target means that short-term profit-taking could temporarily reduce upside momentum.
When price approaches an established target, traders who participated earlier in the move may begin securing profits. This can create a throwback or sideways consolidation even when the broader bullish structure remains intact.
The key factor is therefore the reaction after any pullback. If buyers continue to defend 0.6939, sentiment remains constructive and the market can attempt another move toward or above 0.6985.
A decisive break above 0.6985 would strengthen bullish sentiment and open the path toward 0.6996. Conversely, a sustained break below 0.6939 would signal that buyers are losing control and shift the market toward the alternative downside targets.
AUD/USD Intraday Forecast Support and Resistance Levels
Key Pivot Support: 0.6939
The 0.6939 level is the primary pivot and support for the current AUD/USD Intraday Forecast. The bullish outlook remains valid while price stays above this threshold.
First Upside Target: 0.6985
The first major bullish objective is 0.6985. Price is already approaching this level, making a temporary consolidation or throwback possible.
Second Upside Target: 0.6996
The second target is 0.6996. A clear break above 0.6985 would increase the probability of reaching this level.
Alternative Downside Target: 0.6921
If AUD/USD breaks below 0.6939, the first alternative bearish target becomes 0.6921.
Secondary Downside Target: 0.6911
A sustained move below 0.6921 could expose 0.6911 as the next downside objective.
Key Levels
- Pivot Support: 0.6939
- Target A: 0.6985
- Target B: 0.6996
- Alternative Target A: 0.6921
- Alternative Target B: 0.6911
AUD/USD Intraday Forecast Trading Scenario Analysis
Bullish Scenario
The primary scenario remains bullish while 0.6939 acts as support. If buyers continue to defend this level, AUD/USD can maintain its upward trajectory toward 0.6985.
A clear break above 0.6985 would strengthen the bullish continuation and place 0.6996 in focus. This scenario would confirm that the market has absorbed the resistance near the first target and is prepared to extend the advance.
Throwback Scenario
Because prices are already within reach of 0.6985, a temporary throwback or consolidation is possible. Such a reaction would be a normal response to the market approaching a significant upside target.
The bullish structure would remain intact as long as the pullback stays above 0.6939. If buyers successfully defend the pivot after a correction, the market could regain momentum and make another attempt to break above 0.6985.
Bearish Alternative Scenario
The alternative scenario becomes active if AUD/USD breaks decisively below 0.6939. Such a move would weaken the current bullish structure and indicate that sellers are beginning to regain control.
In this case, the first downside target would be 0.6921, followed by 0.6911 if selling pressure continues. A sustained break below the pivot would therefore invalidate the primary upside preference.
AUD/USD Intraday Forecast Risk Factors and Alternative Outlook
The main risk to the bullish outlook is a failure at the 0.6939 support level. A decisive break below this pivot would signal that the current upside structure has weakened and could trigger a deeper correction toward 0.6921 and 0.6911.
Another risk is resistance around 0.6985. Since price is already approaching the first target, profit-taking could generate a temporary pullback or consolidation. This does not necessarily represent a trend reversal, but it could delay the move toward 0.6996.
The stronger bullish confirmation would come from a clean break above 0.6985. Such a move would indicate that buyers have overcome the immediate resistance and could sustain the upward trajectory toward 0.6996.
The alternative outlook is therefore clearly defined: above 0.6939, the market favors 0.6985 and 0.6996; below 0.6939, attention shifts toward 0.6921 and 0.6911.
AUD/USD Intraday Forecast Conclusion
The current AUD/USD Intraday Forecast remains bullish while 0.6939 acts as support. The primary upside targets are 0.6985 and 0.6996, although the proximity of price to the first target means that a temporary throwback or consolidation may develop.
A pullback that holds above 0.6939 would keep the bullish structure intact and could provide the market with an opportunity to build fresh momentum. A clear break above 0.6985, meanwhile, would strengthen the continuation scenario and open the way toward 0.6996.
Conversely, a decisive break below 0.6939 would invalidate the primary bullish setup and shift attention toward 0.6921 and 0.6911.
For short-term traders, 0.6939 remains the decisive support, while 0.6985 is the key upside level that could determine whether the current advance pauses or extends toward the second target.
FAQ
What is the key level in the AUD/USD Intraday Forecast?
The key level is 0.6939, which currently acts as the main pivot and support. The bullish outlook remains valid while AUD/USD stays above this level.
What are the main bullish targets for AUD/USD?
The primary upside targets are 0.6985 and 0.6996.
Could AUD/USD experience a pullback near 0.6985?
Yes. Because price is approaching the first target, a temporary throwback or consolidation may emerge around 0.6985. This would not necessarily invalidate the bullish setup if 0.6939 remains intact.
What happens if AUD/USD breaks above 0.6985?
A clear break above 0.6985 would strengthen the bullish continuation scenario and increase the probability of a move toward 0.6996.
What happens below 0.6939?
A sustained break below 0.6939 would activate the alternative bearish scenario, with 0.6921 as the first target and 0.6911 as the second.

