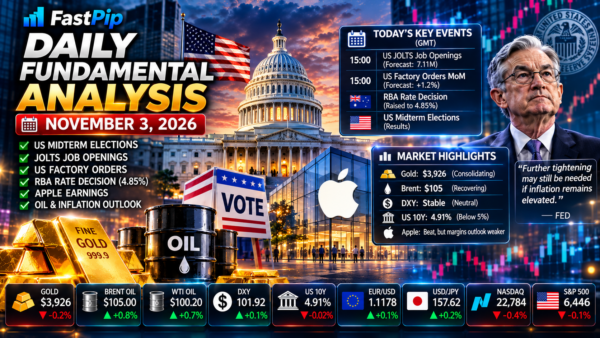
Daily Fundamental Analysis November 4 2026 | FastPip
Daily Fundamental Analysis November 4 2026: 7 Critical Market Drivers
The Daily Fundamental Analysis November 4 2026 begins with a major political shift in Washington, a weaker US dollar, falling Treasury yields, stronger gold prices and another sharp increase in volatility across AI-related equities.
Reuters projected that Democrats won control of both chambers of Congress in the 2026 US midterm elections, delivering a significant setback to President Donald Trump’s Republicans. The political shift is forcing investors to reconsider expectations for fiscal policy, AI regulation, energy policy and government spending.
Gold rose approximately 0.5% to $3,947.49 per ounce, supported by a softer dollar and declining nominal and real Treasury yields. The US 10-year yield moved toward 4.91%, while the Dollar Index weakened toward approximately 101.7.
Technology equities moved sharply in the opposite direction. Nasdaq futures fell more than 2% at one stage as investors considered the possibility of tighter regulation and slower data-center expansion under a Democratic Congress.
Today’s seven major market drivers are:
- Democrats winning control of Congress
- Gold rising toward $3,950
- ADP Employment Change
- ISM Services PMI
- Treasury yields falling below 5%
- AI and Nasdaq regulatory risk
- EIA crude oil inventories and Middle East diplomacy
For live releases throughout today’s session, monitor the FastPip Economic Calendar.
Daily Fundamental Analysis November 4 2026: Global Market Snapshot
| Asset / Market | Latest Reported Level / Move | Fundamental Signal |
|---|---|---|
| Gold / XAUUSD | ~$3,947 | Mildly Bullish |
| DXY | ~101.7 | Mildly Bearish |
| US 10Y Yield | ~4.91% | Lower |
| EUR/USD | ~$1.121 | Mildly Bullish |
| USD/JPY | ~158.3 | Elevated |
| Nasdaq Futures | More than -2% intraday | Bearish / Volatile |
| S&P 500 Futures | Around -1% | Risk-Off |
| Brent Oil | Volatile near recent lows | Neutral |
| US Political Risk | Elevated | High Volatility |
The immediate cross-asset relationship is:
Election Risk ↑ → Treasury Demand ↑ → Yields ↓ → USD ↓ → Gold ↑
while:
AI Regulation Risk ↑ → Nasdaq ↓
That distinction is critical for today’s market.
US Midterm Elections Change the Market Narrative
The biggest development since yesterday is the US election result.
Reuters projected Democrats captured both the House and Senate after strong performances in several traditionally Republican states.
The market is now beginning to price a different political environment for the final two years of the Trump administration.
Potential implications include:
- stronger congressional oversight;
- more scrutiny of AI and data-center expansion;
- greater difficulty passing large fiscal packages;
- potential regulatory changes affecting technology;
- renewed debates over government funding and the debt ceiling.
Why Markets Initially Sold Off
US stock futures fell while Treasury bonds rallied and the dollar weakened.
Investors appear to be pricing two main risks.
First:
Less Fiscal Stimulus
Second:
More Regulation of AI Infrastructure
Reuters reported that investors were particularly concerned about possible restrictions affecting AI data-center development and energy-intensive infrastructure projects.
Election Impact on Gold
Political uncertainty is broadly supportive for gold.
But the stronger near-term catalyst is the Treasury market.
The US 10-year yield fell toward approximately 4.91%.
Lower yields reduce the opportunity cost of holding non-yielding bullion.
At the same time, the dollar declined.
This creates one of the most constructive combinations for gold:
Treasury Yields ↓ + USD ↓ = Gold Support
Gold Fundamental Analysis Today
Gold traded around $3,947 per ounce, extending its recovery from last week’s one-year low.
Reuters reported spot gold rising approximately 0.5% as both nominal and real US Treasury yields fell.
The metal is now approaching the psychologically important $4,000 resistance zone.
Why Gold Is Rising Today
Gold has four immediate bullish drivers:
- lower Treasury yields;
- weaker US dollar;
- political uncertainty;
- continued geopolitical risk.
The unresolved US-Iran conflict also remains an important safe-haven factor.
Gold Bullish Drivers
The broader bullish case includes:
- Treasury yields below 5%;
- softer DXY;
- election uncertainty;
- financial-market volatility;
- AI-sector stress;
- central-bank demand;
- Middle East geopolitical risk.
Gold Bearish Drivers
The main risks remain:
- strong US labor data;
- stronger ISM Services;
- persistent inflation;
- another December Fed hike;
- renewed crude-oil inflation.
Markets still assign a high probability to another Fed rate increase in December. Reuters reported pricing near 78% in today’s gold-market coverage.
Gold Bullish Scenario
Gold could move toward and potentially above $4,000 if:
- ADP employment disappoints;
- ISM Services falls below expectations;
- Treasury yields extend lower;
- DXY falls below 101.5;
- Nasdaq selling intensifies.
Potential reaction:
Gold ↑
Treasuries ↑
DXY ↓
Gold Bearish Scenario
Gold could reverse if:
- ADP employment beats expectations sharply;
- ISM Services strengthens;
- ISM Prices Paid rises;
- US 10-year yields return above 5%.
Potential reaction:
Gold ↓
DXY ↑
USD/JPY ↑
Gold Fundamental Bias
Mildly Bullish
The political and yield environment currently favors bullion.
However, $4,000 remains major resistance.
Traders can compare this macro view with current FastPip Trading Signals.
Yesterday’s JOLTS Data Were Stronger Than Expected
Tuesday’s labor data significantly exceeded expectations.
US Job Openings rose to:
7.523 million
from a revised:
7.190 million
The market consensus was around:
7.10–7.13 million
The Bureau of Labor Statistics also reported that quits increased to 3.365 million, while layoffs declined to 1.641 million, the lowest level since March 2025.
JOLTS Results
| Indicator | Actual | Forecast | Previous |
|---|---|---|---|
| Job Openings | 7.523M | ~7.10M | 7.190M revised |
| Quits | 3.365M | — | ~3.07M |
| Layoffs & Discharges | 1.641M | — | Higher previously |
This was a fundamentally strong labor-market report.
It suggests labor demand remains relatively resilient despite restrictive interest rates.
Factory Orders Also Beat Expectations
US Factory Orders increased:
1.8% month-over-month
compared with a consensus forecast of:
1.2%
The previous reading was revised to approximately:
0.3%
Orders excluding transportation rose approximately 1.3%.
Factory Orders Results
| Indicator | Actual | Forecast | Previous |
|---|---|---|---|
| Factory Orders MoM | 1.8% | 1.2% | 0.3% revised |
| Factory Orders ex Transportation | 1.3% | — | 0.4% |
The combination of stronger JOLTS and Factory Orders supports the argument that the US economy remains resilient.
That is still fundamentally supportive for the dollar and Federal Reserve tightening expectations.
ADP Employment Change: Today’s First Major US Catalyst
The ADP Employment Report is scheduled for 13:15 GMT.
Consensus estimates vary between providers, but cluster around approximately 65K–75K private jobs.
The previous reading was:
90K
The New York Fed’s economic calendar confirms today’s ADP release.
ADP Employment Forecast
| Indicator | Actual | Forecast | Previous |
|---|---|---|---|
| ADP Employment Change | Pending | ~69K | 90K |
Friday’s official Nonfarm Payrolls report remains more important, but ADP can still move Treasury yields and the dollar.
ADP Scenario Analysis
ADP Above 100K
A strong report would reinforce the labor-resilience narrative.
Potential reaction:
December Fed-Hike Probability ↑
Treasury Yields ↑
USD ↑
Gold ↓
ADP Around 65K–75K
A result near consensus would probably have limited impact.
Attention would shift quickly toward ISM Services.
ADP Below 40K
A significant downside surprise could increase concerns about labor-market cooling.
Potential reaction:
Treasury Yields ↓
DXY ↓
Gold ↑
A very weak report could also increase equity volatility.
Friday’s Nonfarm Payrolls Remain the Main Labor Event
The official employment report is scheduled for Friday.
Consensus expectations currently center near:
65K new jobs
versus:
29K previously
The unemployment rate is expected around:
4.2%
Friday’s report remains the most important labor-market input for the December Fed decision.
US ISM Services PMI: Today’s Main Growth Indicator
The ISM Services PMI is scheduled for:
15:00 GMT
Consensus is approximately:
54.8
compared with:
54.9 previously.
A reading above 50 indicates expansion.
Services represent the largest portion of the US economy.
That makes today’s report particularly important.
ISM Services Forecast
| Indicator | Actual | Forecast | Previous |
|---|---|---|---|
| ISM Services PMI | Pending | 54.8 | 54.9 |
| New Orders | Pending | — | 59.8 |
| Prices Index | Pending | — | 74.0 |
The Prices component may be particularly important because inflation remains the Federal Reserve’s primary concern.
ISM Services Scenario Analysis
ISM Above 56 + Prices Remain High
This would be the most hawkish combination.
Potential reaction:
US Growth Expectations ↑
Inflation Risk ↑
Treasury Yields ↑
DXY ↑
Gold ↓
ISM Near 54.8
A result close to consensus would indicate continued service-sector expansion.
Markets would likely remain focused on Friday’s payroll report.
ISM Below 52
A significant downside surprise would challenge the strong-growth narrative.
Potential reaction:
Treasury Yields ↓
USD ↓
Gold ↑
However, Nasdaq could remain weak if election-related regulation fears dominate.
US Dollar Fundamental Analysis
The Dollar Index fell toward approximately 101.7 during Wednesday trading.
The euro strengthened toward $1.1212, while the Japanese yen also gained against the dollar.
The dollar is currently caught between two opposing forces.
USD Bullish Drivers
- stronger JOLTS;
- stronger Factory Orders;
- high inflation;
- December Fed tightening expectations;
- resilient US economic growth.
USD Bearish Drivers
- lower Treasury yields;
- election-driven political uncertainty;
- reduced fiscal-stimulus expectations;
- Treasury safe-haven demand.
US Dollar Fundamental Bias
Neutral to Mildly Bearish
The key question is whether today’s ADP and ISM data can push Treasury yields higher again.
Treasury Yields Are Driving Gold and USD
The US 10-year yield fell toward 4.91%.
This move is critical.
For gold:
10Y ↓ = Bullish
For USD:
10Y ↓ = Bearish
For Nasdaq:
Normally:
10Y ↓ = Bullish
But today Nasdaq is falling despite lower yields.
Why?
Because political and regulatory risk is dominating the normal valuation effect.
This is an important signal.
Nasdaq Fundamental Outlook
Nasdaq futures fell more than 2% during election-night trading.
The decline reflected concerns that a Democratic Congress could impose stricter regulation on AI infrastructure and data centers.
Technology valuations were already under pressure after October’s correction.
Election risk adds another layer.
Nasdaq Bullish Drivers
- falling Treasury yields;
- strong AMD earnings;
- long-term AI demand;
- strong semiconductor revenue.
Nasdaq Bearish Drivers
- AI regulatory risk;
- data-center permitting uncertainty;
- extreme valuations;
- AI financing concerns;
- weaker free cash flow at some hyperscalers.
Nasdaq Fundamental Bias
Bearish / High Volatility
Lower yields provide support, but political risk is currently stronger.
AMD Earnings Provide Some AI Support
AMD delivered stronger-than-expected results and forecast faster data-center growth into 2027.
Reuters reported that the results helped offset some concerns about the durability of AI demand.
However, the broader technology market remained weak because election risk outweighed the positive corporate news.
This is another sign that:
Macro + Politics > Individual Earnings
in today’s session.
S&P 500 Fundamental Outlook
S&P 500 futures fell around 1%–1.2% during the strongest phase of election-related selling.
The index remains less exposed to AI than Nasdaq, but mega-cap technology still carries significant weight.
S&P 500 Fundamental Bias
Neutral to Mildly Bearish
A stabilization in election expectations could reduce volatility later in the session.
Oil Fundamental Analysis Today
Oil remains highly volatile.
Markets continue to weigh diplomatic negotiations with Iran against persistent physical-supply risks around the Strait of Hormuz.
Reuters reported that oil prices remained choppy after recently falling to a four-week low.
Iranian and Qatari officials have continued talks aimed at ending the US-Iran conflict, but no final agreement has been reached.
Oil Bullish Drivers
- Strait of Hormuz disruption;
- attacks on regional shipping;
- possibility of renewed military escalation;
- reduced Gulf export capacity.
Oil Bearish Drivers
- continued diplomatic negotiations;
- reduced geopolitical risk premium;
- weaker global demand;
- election-driven risk-off sentiment.
Oil Fundamental Bias
Neutral / Extremely High Volatility
The next major scheduled catalyst is today’s EIA inventory report.
EIA Crude Oil Inventories
The EIA Weekly Petroleum Status Report is scheduled for:
15:30 GMT
The previous crude-stock change was approximately:
-1.9 million barrels
Some calendar estimates point to a relatively small change this week.
Official data are published by the US Energy Information Administration.
Larger Inventory Draw
Potential reaction:
Oil ↑
Inflation Expectations ↑
Gold Mixed / Pressure
Inventory Build
Potential reaction:
Oil ↓
Inflation Expectations ↓
Gold Support
Geopolitical headlines may still overwhelm the inventory data.
Eurozone Inflation Is Also Important Today
Europe receives October flash CPI data today.
Headline Eurozone inflation is expected around:
4.0% YoY
compared with:
3.8% previously
Core CPI is expected around:
2.5%.
Eurozone CPI Forecast
| Indicator | Actual | Forecast | Previous |
|---|---|---|---|
| Headline CPI YoY | Pending | 4.0% | 3.8% |
| Core CPI YoY | Pending | 2.5% | 2.5% |
A hotter reading could strengthen expectations for further ECB tightening.
EUR/USD Fundamental Analysis
EUR/USD traded around 1.121 as the dollar weakened.
The pair is receiving support from falling US Treasury yields.
However, Europe still faces:
- weak growth;
- high energy costs;
- French fiscal concerns;
- elevated inflation.
EUR/USD Bullish Scenario
Weak ADP + Weak ISM + Hot Eurozone CPI
Potential reaction:
EUR/USD ↑
EUR/USD Bearish Scenario
Strong ADP + Strong ISM
Potential reaction:
US Yields ↑
DXY ↑
EUR/USD ↓
EUR/USD Fundamental Bias
Neutral to Mildly Bullish
USD/JPY Fundamental Analysis
USD/JPY remained elevated around 158 despite a stronger yen during early trading.
The pair continues to reflect the large US-Japan interest-rate differential.
However, falling US yields and the BOJ’s recent tightening bias reduce the upside case.
USD/JPY Fundamental Bias
Neutral
A strong US data package could quickly push the pair higher again.
Today’s Key Economic Events — November 4, 2026
The Daily Fundamental Analysis November 4 2026 includes several major US and European macro releases.
All times are shown in GMT / UTC.
| Time GMT | Currency | Event | Actual | Forecast | Previous |
|---|---|---|---|---|---|
| 10:00 | EUR | Eurozone CPI Flash YoY | Pending | 4.0% | 3.8% |
| 10:00 | EUR | Eurozone Core CPI Flash YoY | Pending | 2.5% | 2.5% |
| 13:15 | USD | ADP Employment Change | Pending | ~69K | 90K |
| 13:30 | USD | Trade Balance | Pending | ~-107.6B | -105.6B |
| 14:45 | USD | Final Services PMI | Pending | 57.9 | 57.9 |
| 15:00 | USD | ISM Services PMI | Pending | 54.8 | 54.9 |
| 15:00 | USD | ISM Services New Orders | Pending | — | 59.8 |
| 15:00 | USD | ISM Services Prices | Pending | — | 74.0 |
| 15:30 | USD | EIA Crude Oil Inventories | Pending | Near Flat | -1.9M |
Release times are confirmed in the New York Fed calendar and current US economic calendars.
For live Actual values, use the FastPip Economic Calendar.
US Trade Balance
The September US Trade Balance is also scheduled for 13:30 GMT.
Consensus estimates center near a deficit of approximately:
$107 billion
compared with:
$105.6 billion previously.
The report is unlikely to dominate today’s session unless the surprise is unusually large.
Daily Fundamental Analysis November 4 2026: Market Bias
| Asset | Fundamental Bias | Confidence | Main Driver |
|---|---|---|---|
| Gold / XAUUSD | Mildly Bullish | High | Lower USD + yields |
| Silver / XAGUSD | Neutral → Bullish | Moderate | Gold recovery |
| DXY | Neutral → Bearish | Moderate | Treasury yields |
| EUR/USD | Neutral → Bullish | Moderate | USD weakness |
| GBP/USD | Neutral | Low | USD direction |
| USD/JPY | Neutral | Moderate | US yields |
| S&P 500 | Neutral → Bearish | High | Election risk |
| Nasdaq | Bearish / Volatile | High | AI regulation risk |
| Brent Oil | Neutral / Volatile | High | Iran diplomacy |
| WTI Oil | Neutral / Volatile | High | Geopolitics + EIA |
| US Treasuries | Bullish | High | Election safe-haven demand |
7 Trader Watchpoints for November 4, 2026
1. Gold Near $3,950
Gold is moving closer to the key $4,000 resistance zone.
A sustained break above $4,000 would materially improve the short-term structure.
2. Democrats Control Congress
The election result changes expectations around fiscal policy, regulation and AI infrastructure.
3. ADP Employment at 13:15 GMT
A large surprise could move Treasury yields before Friday’s official payroll report.
4. ISM Services at 15:00 GMT
The services sector remains the largest part of the US economy.
5. US 10-Year Yield Near 4.91%
This is currently one of gold’s strongest bullish drivers.
6. Nasdaq Election Selloff
AI regulation risk is overpowering the normally bullish effect of lower Treasury yields.
7. EIA Oil Inventories
Crude inventories could influence inflation expectations later in the US session.
Combined Market Scenario Analysis
Scenario 1: Weak ADP + Weak ISM
This is the strongest bullish setup for gold.
Potential reaction:
Treasury Yields ↓
DXY ↓
Gold ↑
EUR/USD ↑
Scenario 2: Strong ADP + Strong ISM + High Prices
This would strengthen the Federal Reserve’s December tightening case.
Potential reaction:
Treasury Yields ↑
DXY ↑
Gold ↓
USD/JPY ↑
Scenario 3: Election Selloff Intensifies
Potential reaction:
Nasdaq ↓
Treasuries ↑
Yields ↓
Gold ↑
This would represent a classic safe-haven environment.
Scenario 4: Election Volatility Fades Quickly
If investors decide the legislative impact will be limited:
Equity Futures Recover
Treasury Safe-Haven Demand ↓
Gold could consolidate rather than extend higher.
Scenario 5: Oil Rallies on Renewed Iran Escalation
Potential reaction:
Oil ↑
Inflation Expectations ↑
December Fed Risk ↑
Gold Volatility ↑
Final Daily Fundamental Outlook
The Daily Fundamental Analysis November 4 2026 shows global markets adjusting to a major political change in Washington.
Democrats have captured control of Congress.
The immediate market response has been:
US Stocks ↓
Treasuries ↑
Treasury Yields ↓
Dollar ↓
Gold ↑
The strongest immediate beneficiary is gold.
Lower nominal and real Treasury yields combined with a softer dollar have allowed bullion to recover toward $3,950.
However, today’s US economic calendar remains capable of reversing that move.
Yesterday’s JOLTS report was significantly stronger than expected.
Factory Orders also beat forecasts.
If today’s ADP and ISM Services data confirm that the US economy remains resilient, Treasury yields could recover and limit gold’s upside.
If the data disappoint, the combination of political uncertainty, lower yields and a softer dollar could allow gold to retest $4,000.
For gold, the strongest bullish combination is:
Weak ADP + Weak ISM + Lower Treasury Yields
The strongest bearish combination is:
Strong ADP + Strong ISM + Higher Services Prices
For the dollar:
US Data vs Treasury Yields
For Nasdaq:
Election Regulation Risk + AI Valuations
For oil:
Iran Diplomacy + EIA Inventories
For the broader week:
Friday’s Nonfarm Payrolls
The central market question today is:
Will weaker Treasury yields and political uncertainty outweigh the evidence that the US labor market remains resilient?
The answer will determine whether gold can challenge $4,000 and whether the dollar can recover from its election-driven decline.
For definitions of ADP Employment, ISM Services, Treasury yields and other market concepts, visit the FastPip Financial Glossary.
Frequently Asked Questions
What Is the Daily Fundamental Analysis November 4 2026 Outlook for Gold?
The Daily Fundamental Analysis November 4 2026 suggests a mildly bullish short-term outlook for gold because the US dollar and Treasury yields are falling.
What Is Gold Trading at Today?
Spot gold traded near $3,947 per ounce, approximately 0.5% higher during Wednesday trading.
Why Is Gold Rising Today?
Gold is benefiting from a weaker dollar, lower nominal and real Treasury yields, political uncertainty and continued geopolitical risk.
What Happened in the US Midterm Elections?
Reuters projected Democrats captured control of both the House and Senate, producing a significant shift in Washington’s political balance.
What Time Is ADP Employment Released?
The ADP Employment Change is scheduled for 13:15 GMT.
What Is the ADP Forecast?
Consensus estimates are clustered around 65K–75K, with approximately 69K a reasonable central estimate, compared with 90K previously.
What Time Is ISM Services Released?
US ISM Services PMI is scheduled for 15:00 GMT.
What Is the ISM Services Forecast?
The index is expected around 54.8, compared with 54.9 previously.
What Was Yesterday’s JOLTS Result?
US Job Openings increased to 7.523 million, above the roughly 7.1 million consensus estimate.
What Was Yesterday’s Factory Orders Result?
Factory Orders increased 1.8% month-over-month, beating the approximately 1.2% forecast.
Why Are Nasdaq Futures Falling?
Nasdaq futures are under pressure because investors are pricing a greater risk of tighter AI and data-center regulation under a Democratic-controlled Congress.
What Should Traders Watch After the Daily Fundamental Analysis November 4 2026?
Following the Daily Fundamental Analysis November 4 2026, traders should monitor gold near $3,950 and the $4,000 resistance zone, ADP Employment, ISM Services, the US 10-year Treasury yield near 4.91%, DXY near 101.7, Nasdaq election volatility, EIA crude inventories and Friday’s Nonfarm Payrolls report.
 Check Our
 Whether you’re a day trader or a long-term investor, FastPip gives you the tools to trade smarter, not harder.