
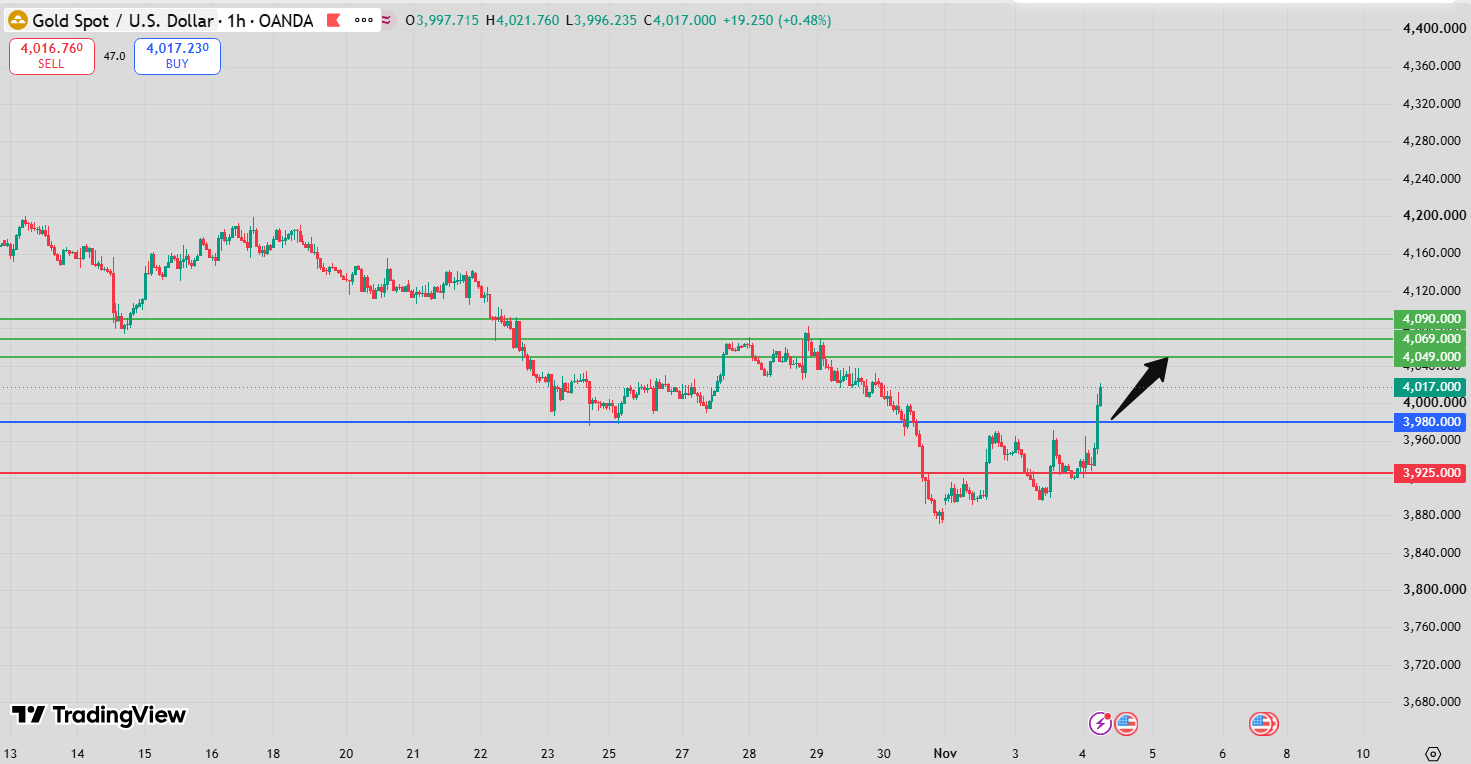
Gold Intraday Forecast: Upside Toward 4,049 and 4,069 While 3,934 Holds as Support
Introduction
The latest Gold Intraday Forecast maintains a bullish outlook as long as 3,934 continues to act as support. The primary upside targets remain 4,049 and 4,069, with the first target representing the next important technical objective for buyers.
The current technical picture supports further upside, although several indicators suggest that gold may be entering an increasingly extended bullish phase. The Relative Strength Index (RSI) is above 70, indicating overbought conditions that could either accompany a persistent uptrend or precede a corrective pullback.
The Moving Average Convergence Divergence (MACD) remains above its signal line and in positive territory, reinforcing the prevailing buying momentum. Gold is also trading above its 20-period moving average at 3,940 and its 50-period moving average at 3,929, suggesting that buyers retain control of the short-term price structure.
Additionally, gold is trading above its upper Bollinger Band at 3,973, highlighting the strength of the recent upward movement. However, this position also increases the possibility of a temporary correction if buying pressure begins to weaken.
The key question is whether gold can extend its advance toward 4,049 while maintaining support above the 3,934 pivot. As long as this level holds, the bullish scenario remains preferred. A decisive break below 3,934 would weaken the upside outlook and shift attention toward 3,901 and 3,881.
Gold Intraday Forecast Technical Analysis
The Gold Intraday Forecast favors further upside while 3,934 holds as support. The current technical configuration supports buyers, with the RSI above 70, the MACD above its signal line and positive, and price trading above both moving averages and the upper Bollinger Band.
The RSI reading above 70 is particularly important because it indicates that gold has entered overbought territory. Such conditions often occur during strong bullish trends when buying pressure remains persistent. However, they may also precede a corrective pullback if buyers begin taking profits or upward momentum becomes exhausted.
Traders should therefore monitor the RSI for signs of bearish divergence. This would occur if gold establishes a higher price high while the RSI forms a lower high, suggesting that upward momentum may be weakening despite continued price gains.
An overbought RSI alone does not confirm an imminent bearish reversal. During strong uptrends, the indicator can remain above 70 for extended periods while prices continue advancing.
The MACD provides additional support for the bullish outlook. With the indicator trading above its signal line and remaining in positive territory, the momentum structure suggests that buyers currently retain the technical advantage.
However, traders should monitor whether the gap between the MACD and its signal line begins to narrow. Such a development could indicate that upward momentum is moderating, particularly if accompanied by weakening price action.
The moving averages reinforce the positive technical structure. Gold is trading above its 20-period moving average at 3,940 and its 50-period moving average at 3,929.
The shorter-term average also stands above the longer-term average, reinforcing the bullish trend configuration.
The 20-period moving average at 3,940 represents an important dynamic support reference, while the 50-period moving average at 3,929 provides an additional technical level during corrective pullbacks.
The main pivot at 3,934 lies between these two moving averages, creating a closely grouped technical support area.
A sustained decline below this zone could signal a meaningful deterioration in the current bullish structure.
Another important feature is gold’s position above the upper Bollinger Band at 3,973. Trading beyond the upper boundary of the volatility envelope indicates an unusually strong upward extension relative to recent price fluctuations.
This condition can occur during powerful bullish trends, but it may also precede a return toward the band as volatility and buying pressure normalize.
The first major upside objective is 4,049. If buyers maintain control and establish a sustained advance toward this level, the second target at 4,069 becomes relevant.
A convincing breakout above 4,049 would strengthen the bullish continuation scenario and increase the possibility of further upside.
Conversely, a decisive break below the 3,934 pivot would weaken the preferred bullish scenario and shift attention toward 3,901, followed by 3,881.
For broader market context, traders can follow FastPip market analysis and monitor scheduled economic releases through the Forex Factory economic calendar.
Gold Intraday Forecast Market Sentiment Analysis
Market sentiment remains bullish within the supplied technical framework while gold trades above 3,934. The combination of an RSI above 70, a positive MACD configuration, and price above both moving averages suggests that buyers retain the immediate technical advantage.
Gold’s position above the upper Bollinger Band at 3,973 further highlights the strength of the recent upward movement.
However, the deeply overbought RSI introduces an important consideration. While bullish momentum remains dominant, the possibility of a temporary corrective pullback may increase if buyers begin taking profits or market participants become reluctant to enter at elevated prices.
The distinction between a persistent bullish trend and an overbought correction is particularly important for the current setup.
If buying pressure continues without meaningful deterioration in momentum indicators, gold could extend its advance toward 4,049.
A convincing breakout above this level would strengthen the continuation scenario and bring 4,069 into focus.
Nevertheless, traders should monitor price behavior around the first target. Profit-taking from existing long positions may generate temporary selling pressure, particularly if the RSI remains deeply overbought.
A corrective decline toward the upper Bollinger Band at 3,973 could develop without necessarily changing the broader bullish outlook.
The moving-average support area around 3,929–3,940 would become another important zone to monitor if a deeper pullback emerges.
Broader factors may also influence gold, including US dollar movements, Treasury yields, Federal Reserve monetary-policy expectations, inflation data, geopolitical developments, and changes in demand for safe-haven assets.
Unexpected economic announcements can produce sharp movements and temporarily override the existing technical structure.
For this intraday setup, the key consideration remains whether gold can sustain its bullish momentum despite overbought conditions while remaining above the 3,934 pivot.
Gold Intraday Forecast Support and Resistance Levels
Key Pivot Support: 3,934
3,934 is the principal support level for the current outlook.
As long as gold remains above this pivot, the bullish scenario remains preferred.
A sustained break below this threshold would weaken the technical structure and increase the possibility of a deeper corrective decline.
Upper Bollinger Band: 3,973
The upper Bollinger Band stands at 3,973, with gold currently trading above this level according to the supplied analysis.
This positioning reflects an extended bullish movement and highlights the possibility of increased volatility.
A return toward the band could represent a temporary technical correction rather than a confirmed reversal.
20-Period Moving Average: 3,940
The 20-period moving average at 3,940 represents an important short-term support reference.
Gold is currently trading above this average, suggesting that buying pressure remains active.
A sustained decline below 3,940 could indicate weakening immediate momentum, although the primary pivot at 3,934 would remain the key level separating the preferred bullish and bearish scenarios.
50-Period Moving Average: 3,929
The 50-period moving average stands at 3,929, below both the shorter-term moving average and the current price.
This positioning reinforces the bullish trend structure and identifies a potential support area during a deeper correction.
A sustained move below this average could indicate that sellers are gaining influence over the short-term market direction.
First Upside Target: 4,049
4,049 represents the first major upside objective.
If buyers maintain control and gold continues its advance, this level could become the next important technical destination.
As price approaches this target, traders should monitor for profit-taking, temporary consolidation, or a convincing breakout.
Second Upside Target: 4,069
If buying pressure continues beyond 4,049, the next objective becomes 4,069.
This level represents the second bullish target and may become another area where sellers attempt to limit the advance.
Third Upside Target: 4,090
4,090 represents an illustrative extended upside objective beyond the original target at 4,069.
If buyers establish a convincing breakout above the second target and maintain upward momentum, this level could become an additional price objective.
However, this target is a suggested extension rather than a confirmed resistance level from the original analysis.
Alternative Downside Target: 3,901
A decisive break below 3,934 would shift attention toward 3,901, the first downside objective in the alternative scenario.
Such a development would indicate that the preferred bullish structure is weakening and that sellers may be gaining control.
Second Alternative Downside Target: 3,881
If selling pressure continues below 3,901, the next downside objective becomes 3,881.
A sustained decline toward this level would indicate a more substantial deterioration in the short-term technical outlook.
Key Levels Summary
-
Pivot / Support: 3,934
-
Upper Bollinger Band: 3,973
-
20-period moving average: 3,940
-
50-period moving average: 3,929
-
Target A: 4,049
-
Target B: 4,069
-
Target C: 4,090 (suggested)
-
Alternative Target A: 3,901
-
Alternative Target B: 3,881
Gold Intraday Forecast Trading Scenario Analysis
Bullish Continuation Scenario
The preferred scenario remains bullish while gold trades above 3,934. The RSI above 70, positive MACD configuration, and price above both moving averages support the continuation outlook.
Gold’s position above the upper Bollinger Band at 3,973 further highlights the strength of the prevailing buying pressure. However, this extended technical condition also increases the importance of monitoring whether momentum remains sustainable.
If buyers maintain control and gold continues to establish a constructive intraday price structure, the market could advance toward the first upside objective at 4,049.
A convincing breakout above 4,049 would strengthen the bullish continuation scenario and bring 4,069 into focus.
If upward momentum remains persistent beyond the second target, the additional illustrative objective at 4,090 could become relevant.
However, this extended target requires further technical confirmation and is not part of the original signal.
Traders should distinguish a sustained breakout from a temporary price movement above resistance before assuming that the higher objectives are likely to be reached.
The bullish scenario would remain preferred as long as the primary support at 3,934 continues to hold.
Consolidation and Pullback Scenario
Gold may experience a temporary correction or consolidation because the RSI is above 70 and price is trading beyond the upper Bollinger Band at 3,973.
These conditions suggest that the recent upward movement may be technically extended, potentially increasing the possibility of short-term profit-taking.
An initial correction toward 3,973 would represent a return toward the upper boundary of the Bollinger Band.
Such a movement would not automatically invalidate the bullish scenario.
If selling pressure intensifies, the 20-period moving average at 3,940 could become an important support reference.
The main pivot at 3,934 and the 50-period moving average at 3,929 form a closely grouped technical area that may become relevant during a deeper correction.
If gold stabilizes around these levels and buyers regain control, the market could make another attempt toward 4,049.
Traders should monitor the RSI for bearish divergence, particularly if gold establishes a higher price high while the indicator forms a lower high.
A narrowing gap between the MACD and its signal line could also indicate that bullish momentum is weakening.
However, a temporary pullback would remain consistent with the broader positive outlook while 3,934 continues to act as support.
Bearish Alternative Scenario
The bearish alternative becomes relevant if gold decisively breaks below 3,934.
Such a move would weaken the preferred bullish structure and shift attention toward 3,901.
A sustained decline below the pivot could indicate that sellers are overcoming previous buying pressure and establishing a weaker short-term technical structure.
The deeply overbought RSI introduces the possibility that an initial correction could accelerate if buyers begin closing positions.
A bearish divergence in the RSI or a negative MACD crossover could provide additional confirmation of weakening momentum if these developments occur.
However, neither condition is confirmed by the supplied signal.
If sellers maintain control and gold also breaks below 3,901, the next downside objective becomes 3,881.
A sustained decline through these levels would suggest that the earlier bullish momentum is losing strength and that the market may be entering a more substantial corrective phase.
Gold Intraday Forecast Risk Factors and Alternative Outlook
The main risk to the bullish outlook is the possibility of a sharp corrective pullback resulting from overbought conditions.
The RSI above 70 indicates that buying momentum has reached overbought territory. Although this can occur during persistent uptrends, it may also increase the possibility of a correction if buyers begin taking profits.
Gold’s position above the upper Bollinger Band at 3,973 reinforces this concern.
A return inside the band could occur as volatility normalizes, potentially generating a corrective decline even while the broader bullish structure remains intact.
Another important risk is bearish divergence in the RSI. If gold establishes a higher price high while the RSI forms a lower high, it could indicate weakening upward momentum and increase the possibility of a short-term reversal.
However, divergence should be evaluated alongside price action rather than treated as automatic confirmation of a trend change.
The MACD currently supports the bullish outlook because it remains above its signal line and in positive territory.
Nevertheless, a narrowing gap between the MACD and its signal line could indicate that buying momentum is moderating.
A decline below the 20-period moving average at 3,940 could provide an early indication of weakening short-term momentum.
The most important technical risk remains a decisive break below 3,934, which would weaken the bullish scenario and expose 3,901 and 3,881.
The proximity of the 50-period moving average at 3,929 to the main pivot also makes this support region particularly important during a deeper correction.
Profit-taking near the first upside target at 4,049 presents another risk. If gold fails to establish a convincing breakout above this level, sellers could attempt a temporary reversal.
A false breakout could also occur if gold briefly advances above 4,049 before falling back below resistance, potentially trapping traders who enter long positions too late.
External developments may influence gold prices. Changes in the US dollar, Treasury yields, Federal Reserve monetary-policy expectations, inflation data, geopolitical conditions, and safe-haven demand can trigger rapid market movements.
Traders should apply appropriate position sizing and risk management because technical targets are conditional scenarios rather than guaranteed outcomes.
Gold Intraday Forecast Conclusion
The Gold Intraday Forecast remains bullish while 3,934 holds as support. The RSI above 70, positive MACD configuration, and price above the 20-period and 50-period moving averages reinforce the current upward technical outlook.
The primary upside targets are 4,049 and 4,069.
Gold’s position above the upper Bollinger Band at 3,973 highlights the strength of buying pressure but also suggests that the recent advance may be technically extended.
The overbought RSI introduces the possibility of a temporary corrective decline, particularly if bearish divergence develops or traders begin taking profits.
The 20-period moving average at 3,940, the main pivot at 3,934, and the 50-period moving average at 3,929 represent important technical references during potential pullbacks.
A convincing breakout above 4,049 could strengthen the continuation scenario and open the way toward 4,069.
If buying pressure remains strong beyond the second target, the additional illustrative objective at 4,090 could become relevant.
Conversely, a decisive break below 3,934 would weaken the bullish outlook and shift attention toward 3,901, followed by 3,881.
For the current intraday setup, 3,934 remains the critical pivot, while the behavior of the overbought RSI and price reaction near 4,049 will help determine whether buyers can sustain the advance or whether a corrective recovery in selling pressure is beginning.
FAQ
What is the current Gold Intraday Forecast?
The outlook remains bullish while gold trades above 3,934, with upside targets at 4,049 and 4,069.
What does an RSI above 70 indicate?
An RSI above 70 indicates overbought conditions. This may occur during a strong uptrend or precede a corrective pullback if buying momentum begins to weaken. Traders should monitor for bearish divergence.
What do the MACD and moving averages indicate?
The MACD is above its signal line and positive, while gold trades above its 20-period moving average at 3,940 and its 50-period moving average at 3,929. These conditions support the prevailing bullish structure.
Why is the upper Bollinger Band at 3,973 important?
Gold is trading above the upper Bollinger Band at 3,973, indicating an extended upward movement. This can reflect strong buying pressure but may also precede a temporary correction toward the band.
What happens if gold breaks below 3,934?
A decisive break below 3,934 would weaken the bullish outlook and expose 3,901 and 3,881 as the alternative downside targets.