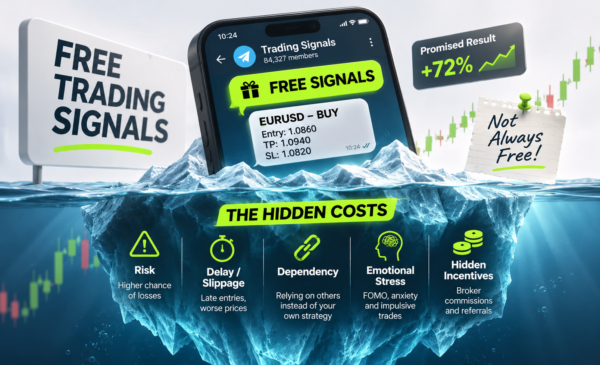

Profit-Only Signal Channels: Why Showing Only Winning Trades Can Mislead Traders
Profit-Only Signal Channels: Why Showing Only Winning Trades Can Mislead Traders
Some trading signal channels appear almost impossible to beat.
Every day seems to contain another winner.
You see:
Gold TP Hit ✅
EURUSD +120 Pips ✅
Another Perfect Entry ✅
VIP Members Winning Again ✅
After seeing enough of these posts, it is easy to form a conclusion:
“This channel must have an extremely profitable strategy.”
But there is a problem.
You are judging the service based on what the channel chooses to show you.
And what is shown may not represent the complete trading history.
This is the central issue with profit-only signal channels.
The profitable trades may be completely real.
The screenshots may be genuine.
The provider may not have fabricated anything.
Yet the overall impression can still be misleading if:
- Losing trades are missing
- Weak months are excluded
- Old winners are repeatedly reposted
- Risk is not disclosed
- Drawdowns are hidden
- Only exceptional trades receive attention
In financial analysis, completeness matters just as much as accuracy.
A true statement based on incomplete data can still produce a false conclusion.
That is why traders should not ask only:
“Are these winning trades real?”
They should also ask:
“What results are not being shown?”
Why Do Some Signal Channels Show Only Winning Trades?
The simplest reason is also the most powerful:
Winning trades attract attention.
A green profit screenshot is:
- Easy to understand
- Emotionally powerful
- Visually attractive
- Highly shareable
A losing trade is not.
This creates a natural marketing incentive to highlight success.
There is nothing automatically wrong with promoting a successful trade.
The problem begins when selected winners are presented in a way that makes users believe they represent the complete performance record.
Winning Trades Build Trust Faster
Imagine discovering two signal channels.
Channel A
Shows:
- 15 winning screenshots
- “TP HIT” posts
- Large pip profits
- Positive testimonials
Channel B
Shows:
- Winners
- Losers
- Drawdown
- Monthly statistics
- Risk metrics
Channel A may initially look far more impressive.
But Channel B actually gives you more information.
This is one reason profit-only signal channels can gain trust faster than transparent services.
The simple story is often more persuasive than the complete one.
Cherry-Picking in Profit-Only Signal Channels
The practice of selecting only favorable results is often called cherry-picking.
Suppose a provider publishes 100 signals.
Results:
- 57 winners
- 43 losers
But its public channel repeatedly highlights only:
- The best 10 Gold trades
- The best 5 EURUSD trades
- One exceptional Bitcoin trade
A new visitor does not see 100 observations.
They see 16 carefully selected winners.
Their perception of performance can therefore become completely different from the underlying reality.
Investor.gov explicitly warns that cherry-picked performance can emphasize profitable investments or periods with strong returns while excluding poor results.
Investor.gov – Performance Claims
Real Trades Can Still Create a Misleading Record
This distinction is critical.
A channel does not need to fake screenshots.
Imagine all ten profitable screenshots are 100% authentic.
The problem is simply that another 20 losing trades are not shown.
Then:
Visible Data = True
but:
Overall Impression = Misleading
The issue is not necessarily falsification.
It is selection.
Why Hiding Losing Trades Changes Everything
Losing trades determine some of the most important statistics in trading.
Without them, you cannot accurately calculate:
- Win rate
- Average loss
- Risk-to-reward
- Profit factor
- Expectancy
- Maximum Drawdown
- Losing streaks
Suppose a provider shows eight profitable trades.
If those are:
8 winners from 10 trades
the service may deserve further investigation.
If they are:
8 winners from 40 trades
the interpretation is completely different.
The screenshots look identical.
The underlying system does not.
Losing Trades Are Not Evidence of a Bad Strategy
This is equally important.
Professional trading involves losses.
A strategy can be profitable with:
- 70% win rate
- 55% win rate
- 40% win rate
depending on its risk-to-reward structure.
So a transparent provider showing losing trades should not automatically be judged negatively.
In fact, openly reporting losses may be a sign of better reporting discipline.
Why Repeated Winners Create an Illusion of Stability
The psychological effect becomes stronger when profits are shown repeatedly.
Imagine seeing:
Monday → WIN
Tuesday → WIN
Wednesday → WIN
Thursday → WIN
Friday → WIN
Your brain begins forming a pattern:
“This service consistently wins.”
But what if those five trades were selected from 20 trades?
The perceived sequence does not represent the real sequence.
This is how repetition can create the illusion of consistency.
Selected Screenshots Can Build a False Performance Story
A screenshot alone is a single observation.
But multiple screenshots displayed in sequence become a story.
For example:
Perfect entry → Target reached → Another winner → Another target → Another winning week
The user begins interpreting these events as evidence of a stable process.
Yet perhaps the actual history looked like:
Winner
Loss
Loss
Winner
Loss
Winner
Winner
Loss
The story changed because the unwanted observations disappeared.
Why Profit-Only Signal Channels Can Distort Win Rate
Suppose a channel publishes 20 profitable screenshots during a month.
A user may subconsciously think:
“They won around 20 trades.”
But the relevant question is:
How many total trades were issued?
If the provider published:
20 winners from 25 trades → 80% win rate
20 winners from 50 trades → 40% win rate
20 winners from 100 trades → 20% win rate
The same number of profitable posts can correspond to radically different performance.
Profit Without Risk Means Very Little
Another major weakness of profit-only reporting is that it focuses on reward while hiding risk.
Suppose you see:
+$2,000 Profit
That looks excellent.
But imagine the position risked:
$15,000
to earn that $2,000.
Now imagine another trade earned:
$2,000
while risking only:
$1,000
The final screenshot might show the same profit.
The quality of the two trades is completely different.
Position Size Can Make Profit Screenshots Meaningless
A $5,000 profit sounds impressive.
But was it generated on:
- A $10,000 account?
- A $100,000 account?
- A $5 million account?
Without account size and risk context, absolute profit numbers tell you very little.
This is why traders should evaluate performance in terms of:
- Percentage return
- Risk
- Drawdown
- Capital exposure
not simply dollar profits.
Drawdown Is Usually Missing
One of the biggest things profit-only signal channels rarely advertise is Drawdown.
Suppose two services both produce:
+30% annual return
Provider A:
Maximum Drawdown: 9%
Provider B:
Maximum Drawdown: 47%
The headline return is identical.
The actual experience is completely different.
Why Drawdown Matters
Drawdown reveals how much capital declined from a previous peak.
It can expose:
- Excessive leverage
- Large losing streaks
- Poor risk management
- Martingale
- Averaging into losses
A screenshot saying:
TP HIT
does not reveal any of these issues.
A Winning Trade Can Contain Bad Risk Management
Imagine this sequence:
- Provider issues BUY
- Price falls sharply
- Stop Loss approaches
- Provider removes the Stop Loss
- Position remains open
- Provider adds another position
- Market eventually reverses
- Both positions close in profit
The final post says:
ANOTHER WIN ✅
Technically, the trade ended profitably.
But the process contained serious risk.
The final screenshot hides almost everything that matters.
Martingale Can Produce Beautiful Winning Histories
High-risk systems can sometimes produce long strings of winners.
Examples include:
- Martingale
- Grid trading
- Aggressive averaging
The system may repeatedly recover losing positions.
Public history looks excellent.
Then one extreme market movement produces a very large loss.
This is why win frequency alone cannot measure strategy quality.
One Profitable Trade Has Almost No Analytical Value
A single winner may result from:
- Skill
- Luck
- Strong trend
- News volatility
- Excessive leverage
- Random timing
There is no way to distinguish these from one observation.
A strategy must be evaluated across a meaningful sample.
Sample Size Changes Everything
Suppose a system produces:
9 winners from 10 trades.
That is interesting.
But statistically it provides much less evidence than:
180 winners from 200 trades.
Small samples are more sensitive to randomness.
This is another reason isolated screenshots are weak evidence.
The Best Trade Is Not the Average Trade
Marketing naturally shows:
Best trade
Professional analysis asks:
What does the average trade look like?
Imagine a service produces:
- One +10R winner
- Five +1R winners
- Ten -1R losers
The +10R trade produces the best screenshot.
But evaluating the strategy requires every trade.
Average Performance Matters More Than Peak Performance
Consider:
Strategy A
Monthly returns:
+5%
+6%
+4%
+5%
Strategy B
Monthly returns:
+25%
-18%
+22%
-20%
Strategy B generates much better screenshots.
Strategy A may be significantly easier to manage.
Performance stability matters.
Timing Can Also Be Cherry-Picked
Selection does not only apply to trades.
It can also apply to periods.
Imagine a provider has:
January: -8%
February: -5%
March: +24%
April: -6%
May: +2%
If marketing focuses almost exclusively on:
March: +24%
users may develop an unrealistic view of historical performance.
Investor.gov specifically describes cherry-picking as highlighting profitable investments or periods of strong returns while excluding weaker periods.
Old Winners Can Be Recycled
Another issue is repeated publication of old trades.
A provider may repeatedly share:
Gold +700 Pips
for months.
The trade may genuinely have happened.
But new users can mistakenly assume exceptional results occur more frequently than they actually do.
Whenever you see a dramatic result, ask:
- When did it happen?
- How often does this happen?
- What occurred between the winning trades?
Periods With No Trades Matter Too
An overlooked issue is trade frequency.
Suppose a strategy produces ten excellent trades annually.
That may be perfectly valid.
But if those ten trades are repeatedly promoted without showing long inactive periods, users may assume the system constantly generates opportunities.
It does not.
Periods of inactivity are part of strategy behavior.
Sometimes the Best Trading Decision Is No Trade
Professional traders often avoid markets when conditions do not match their strategy.
That means:
No trade
can itself be part of good risk management.
Profit-only marketing usually removes these periods because they are not visually interesting.
But removing them can exaggerate the apparent activity of the strategy.
Market Conditions Are Often Missing
Suppose a breakout strategy performs exceptionally during a strong trend.
Winning trades are posted continuously.
Then the market becomes range-bound.
Performance deteriorates.
If only the trending-market screenshots are shown, traders may incorrectly believe the strategy works equally well across all market environments.
Every Strategy Has a Market Regime
A strategy may behave differently during:
- Trending markets
- Ranging markets
- High volatility
- Low volatility
- Major news events
Professional analysis should consider these conditions.
Profit-only reporting rarely does.
Profit-Only Signal Channels and Survivorship Bias
This issue also connects directly to Survivorship Bias.
If successful trades remain visible while losses disappear, users effectively analyze only the survivors.
FastPip has already examined this phenomenon in detail.
FastPip – Survivorship Bias in Trading Signals
The article explains why incomplete samples can make signal performance look stronger than the underlying reality.
The Same Problem Exists With Profit Screenshots
A related FastPip analysis examined why individual trading screenshots cannot prove signal quality.
FastPip – Trading Signal Profit Screenshots
That article shows why screenshots cannot reveal crucial variables such as sample size, Drawdown, risk-to-reward, position sizing, and long-term consistency.
The difference here is important:
Profit Screenshot Problem:
One image cannot prove performance.
Profit-Only Channel Problem:
An entire channel can build a misleading performance narrative by systematically selecting only successful images.
Psychological Bias Makes Profit-Only Content Powerful
Humans do not process all information equally.
Large profits are memorable.
Losses are unpleasant.
Simple stories are easier to understand than complex datasets.
This makes profit-only content extremely persuasive.
Repetition Creates Familiarity
If users see a channel producing winning screenshots every day, the service becomes familiar.
Familiarity can gradually be interpreted as credibility.
But frequent exposure is not equivalent to statistical verification.
Confirmation Bias Can Strengthen the Effect
Suppose a user already believes:
“This provider is excellent.”
They will naturally notice:
- Winning trades
- Successful forecasts
- Positive testimonials
and may pay less attention to:
- Losing trades
- Execution issues
- Missing statistics
That can strengthen an inaccurate belief.
Social Media Amplifies Winning Trades
Social platforms reward content that generates attention.
A screenshot saying:
+$5,000 PROFIT
is likely to attract more engagement than:
Monthly Report: 54% win rate, 13% Drawdown
The first is better marketing.
The second is better analysis.
Investor.gov warned in February 2026 that investors should not make decisions solely from social-media investment information and highlighted stock-tip and investment-chat risks.
Investor.gov – Social Media and Stock Tip Scams
Profit-Only Channels Can Build Trust Gradually
One particularly powerful mechanism is repeated exposure.
At first:
One winning screenshot.
Then:
Five winners.
Then:
Twenty.
Eventually, the user may think:
“I have followed this channel for months. They clearly know what they are doing.”
But the user may actually have monitored:
months of selected winners
rather than:
months of complete performance.
That distinction matters enormously.
Why Independent Verification Matters
A screenshot requires belief.
A performance record allows analysis.
The stronger the verification process, the less room exists for selective reporting.
Ideally, traders should look for:
- Complete historical records
- Original timestamps
- Consistent reporting
- Winners and losers
- Monthly statistics
- Drawdown
- Account-level performance
Auditable Results Are Stronger Than Promotional Results
An auditable performance history answers questions such as:
- How many trades occurred?
- When did they occur?
- Were losing trades included?
- How did equity change?
- What was maximum Drawdown?
- What was the average risk?
A promotional screenshot answers:
“Did at least one winning trade occur?”
These are completely different levels of evidence.
Why No Complete Report Is a Warning Sign
The absence of a full performance report does not automatically prove dishonesty.
But it means the user has limited evidence.
This distinction is important.
You should not conclude:
“No report = scam.”
A more accurate conclusion is:
“No report = performance cannot be properly verified.”
What a Complete Signal Performance Report Should Include
At minimum:
| Metric | Why It Matters |
|---|---|
| Total Trades | Shows sample size |
| Winning Trades | Measures frequency of wins |
| Losing Trades | Reveals downside |
| Win Rate | Shows outcome frequency |
| Average Winner | Shows typical positive result |
| Average Loser | Shows typical negative result |
| Risk-to-Reward | Measures trade structure |
| Net Return | Shows total outcome |
| Maximum Drawdown | Shows historical risk |
| Consecutive Losses | Reveals difficult periods |
| Trade Frequency | Shows activity level |
| Time Period | Provides context |
That table gives you something screenshots cannot:
a measurable system.
Risk-Adjusted Results Matter More Than Raw Profit
Suppose two providers generate:
+40%
Provider A:
Max Drawdown: 10%
Provider B:
Max Drawdown: 60%
It would be misleading to treat them as equivalent.
Professional evaluation must consider risk alongside return.
High Win Rate Does Not Automatically Mean High Quality
Consider:
Provider A
Win rate: 85%
Average win: +0.5R
Average loss: -4R
Provider B
Win rate: 45%
Average win: +2R
Average loss: -1R
Provider A looks better in screenshots.
Provider B may have better expectancy.
This is why a channel filled with winners can still have a weak trading model.
Why Risk Management Is More Important Than Screenshots
A professional signal should ideally define:
- Entry
- Stop Loss
- Take Profit
- Invalidity condition
- Risk assumptions
Without these, users cannot properly evaluate the trade.
FastPip’s Trading Types guide also explains how different trading styles create different execution, frequency, and risk profiles.
How to Evaluate Profit-Only Signal Channels
Use this checklist.
1. Can You Find Losing Trades?
If every result is profitable, investigate further.
2. Is the Complete History Available?
You want all trades, not highlights.
3. Are Results Presented Chronologically?
A continuous timeline is more informative than selected examples.
4. Is Maximum Drawdown Reported?
Profit without Drawdown is incomplete.
5. Is Risk Per Trade Disclosed?
You need to know how aggressively results were achieved.
6. Is Trade Frequency Clear?
Ten winners across one month and ten winners across three years are not comparable.
7. Are Losing Periods Discussed?
Every real system experiences difficult periods.
8. Are Old Winners Reposted Frequently?
Repeated success stories can exaggerate perceived frequency.
9. Can Results Be Independently Verified?
Independent evidence is stronger than screenshots.
10. Are Marketing Claims Realistic?
Be cautious with:
- Guaranteed profits
- No losses
- 100% accuracy
- Risk-free income
Build Your Own Record
Do not depend entirely on the provider’s reporting.
Track the signals yourself.
Record:
- Date
- Symbol
- Direction
- Entry
- Stop Loss
- Take Profit
- Provider result
- Your actual result
After enough observations, you can calculate your own statistics.
This protects you from selective reporting.
Use a Trading Journal
A trading journal can help determine whether the channel’s public image matches your actual experience.
You can track:
- Winners
- Losers
- Slippage
- Missed entries
- Risk
- Execution differences
The objective is to create your own evidence instead of relying on promotional content.
Do Not Judge a Signal Service by Its Best Week
Another common mistake is joining a service after an extraordinary period.
A channel may have recently produced:
10 excellent trades.
Users join.
Then performance returns to normal.
This is performance chasing.
Evaluate the entire history instead of recent highlights.
Transparency Is a Better Trust Signal Than Constant Winning
A trustworthy provider does not need to pretend losses never happen.
In fact, reporting:
Stop Loss hit
can strengthen credibility if it is part of consistent transparent reporting.
Professional traders understand that losses are unavoidable.
Pretending otherwise creates unrealistic expectations.
Healthy Marketing vs. Misleading Marketing
There is nothing wrong with showing winning trades.
The difference lies in context.
Healthy
“Here is one of our best trades this week. Full weekly results include 8 winners and 4 losses.”
Misleading
“Another WIN! We never miss.”
while losses remain invisible.
The winning trade may be identical.
The context changes everything.
Do Profit-Only Signal Channels Automatically Mean Fraud?
No.
This article should not be interpreted that way.
A channel may show winners because:
- Positive content performs better
- The provider uses social media mainly for marketing
- Complete statistics are published elsewhere
The correct approach is therefore:
Verify before judging.
Look for the missing information.
When Should You Be Concerned?
Concern increases when multiple warning signs appear together:
- Only winners are visible
- Losses are deleted
- No historical report exists
- No Drawdown data
- Unrealistic win-rate claims
- Heavy luxury marketing
- Aggressive pressure to subscribe
- Guaranteed returns
- Results cannot be independently checked
One warning sign may have an explanation.
Several together deserve serious scrutiny.
The Most Important Question to Ask
When looking at profit-only signal channels, do not begin with:
“How much profit did they show?”
Start with:
“What wasn’t shown?”
That question changes the entire analysis.
You begin looking for:
- Missing losses
- Missing months
- Missing Drawdowns
- Missing risk
- Missing timestamps
- Missing trade frequency
And that is exactly where the most important information is often found.
Conclusion: Profit-Only Signal Channels Show Results, Not Necessarily Reality
Profit-only signal channels can create an extremely convincing picture of trading success.
The winning trades may be real.
The profits may be real.
The screenshots may be real.
But the picture can still be incomplete.
The central problem is selection.
When a channel displays only:
- Winners
- Best months
- Exceptional trades
- Profitable screenshots
while excluding:
- Losses
- Drawdowns
- Weak periods
- No-trade periods
- Risk
the visible sample no longer represents the complete trading process.
Investor.gov specifically warns that cherry-picked performance can highlight profitable investments or strong periods while omitting weaker results.
Professional evaluation should therefore focus on:
Complete History + Risk + Drawdown + Sample Size + Consistency + Transparency
rather than:
Screenshots + Claims + Selected Winners
A channel showing losses is not automatically a weak channel.
In many cases, acknowledging losses may actually provide more useful information than publishing endless winning screenshots.
The most important principle is simple:
A real performance record includes both sides of trading.
So whenever a channel appears to win all the time, ask one question:
What am I not seeing?
The answer may tell you much more than the profits being advertised.
Frequently Asked Questions
What are profit-only signal channels?
Profit-only signal channels are services or social-media channels that primarily publish successful trades while providing limited visibility into losing trades or weak performance periods.
Are profit-only signal channels necessarily scams?
No. Showing successful trades does not automatically indicate fraud. The problem arises when selected results are presented as though they represent complete performance.
What is cherry-picking in signal channels?
Cherry-picking means selecting favorable trades or periods for display while excluding poor-performing observations.
Why are losing trades important?
Losses are required to calculate true win rate, average loss, Drawdown, risk-to-reward, expectancy, and overall strategy quality.
Can real screenshots still be misleading?
Yes. Completely authentic screenshots can still create a misleading impression if they represent only selected winning trades.
Why is Maximum Drawdown important?
Maximum Drawdown shows how far capital declined from a previous peak and provides important information about strategy risk.
Is a high win rate enough to prove quality?
No. A strategy can have a high win rate and still lose money if losing trades are significantly larger than winners.
Why does sample size matter?
A larger sample helps distinguish repeatable performance from luck or unusual market conditions.
What should a complete signal report include?
It should ideally include total trades, winners, losers, win rate, average wins and losses, Drawdown, risk, net return, and the relevant time period.
Can old winning trades distort perception?
Yes. Repeatedly reposting exceptional historical winners can make those results appear more frequent than they actually are.
What is survivorship bias in signal channels?
It occurs when traders mainly observe successful trades, strategies, or channels while unsuccessful ones disappear from view.
Why can repeated winning screenshots create false trust?
Repeated exposure can create an impression of stability even when the displayed trades are only a selected subset of total performance.
Should signal channels publish every loss?
A provider does not need to turn every promotional post into a loss report, but complete performance data should ideally make both winning and losing results available.
What is the biggest red flag in a profit-only signal channel?
The combination of constant winning screenshots with no verifiable full performance history, no Drawdown information, and unrealistic profitability claims is particularly concerning.
What is the best way to evaluate a signal channel?
Use complete performance data, independently track signals, assess risk and Drawdown, and avoid judging the service from isolated winning trades.