
AUD/USD Intraday Forecast: Bearish Below 0.6757
AUD/USD Intraday Forecast
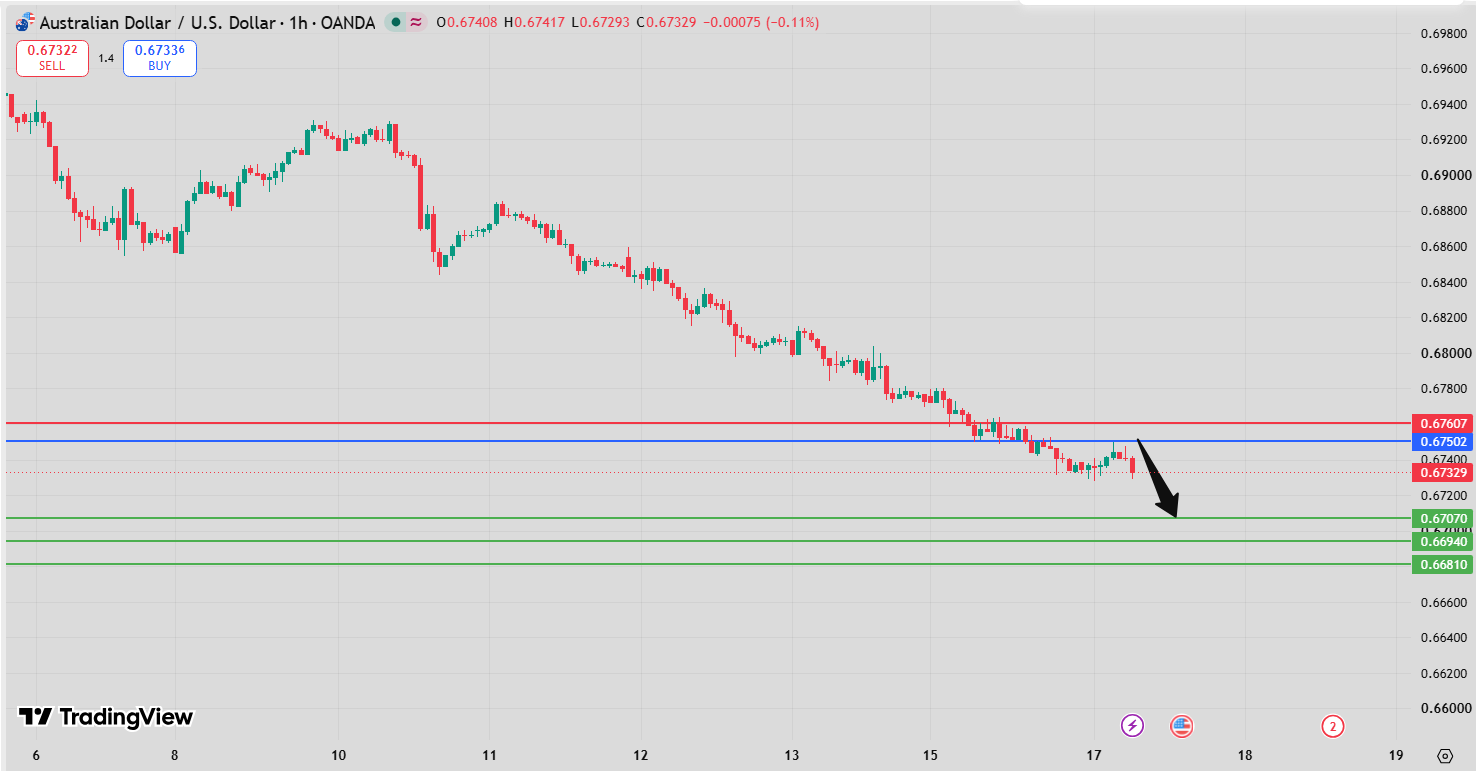
The latest AUD/USD Intraday Forecast maintains a bearish outlook while 0.6757 acts as resistance. The primary downside targets are 0.6707 and 0.6694.
AUD/USD is approaching its critical pivot, creating an important technical decision point. A rejection near 0.6757 could trigger renewed selling pressure, while a sustained breakout would weaken the bearish scenario.
AUD/USD Intraday Forecast Technical Analysis
The technical outlook remains bearish below 0.6757.
This pivot represents the main resistance separating the preferred downside scenario from a potential bullish reversal.
With price approaching the pivot, traders should monitor whether sellers regain control near resistance.
A successful bearish rejection could push AUD/USD toward 0.6707, followed by 0.6694 if selling pressure strengthens.
A sustained breakdown below 0.6694 could expose 0.6681, a suggested downside extension.
Conversely, a decisive breakout above 0.6757 would weaken the bearish structure and expose 0.6778 and 0.6791.
The supplied analysis does not include RSI, MACD, or moving-average readings, so additional momentum confirmation is unavailable.
Traders can follow broader developments through FastPip and monitor upcoming events on the Forex Factory economic calendar.
AUD/USD Intraday Forecast Market Sentiment Analysis
Market sentiment remains cautiously bearish while AUD/USD holds below 0.6757.
However, the proximity to this resistance level suggests that the pair is approaching a decisive turning point.
A rejection from the pivot could reinforce bearish sentiment and encourage renewed selling toward 0.6707.
Alternatively, sustained buying pressure above 0.6757 could shift sentiment toward a recovery targeting 0.6778 and 0.6791.
AUD/USD Intraday Forecast Support and Resistance Levels
| Level | Price | Significance |
|---|---|---|
| Pivot resistance | 0.6757 | Bearish invalidation |
| Target A | 0.6707 | First bearish target |
| Target B | 0.6694 | Second bearish target |
| Target C | 0.6681 | Suggested extension |
| Alternative A | 0.6778 | First bullish target |
| Alternative B | 0.6791 | Second bullish target |
AUD/USD Intraday Forecast Trading Scenario Analysis
Bearish Continuation
Holding below 0.6757 preserves the bearish outlook. A rejection near the pivot could trigger renewed selling toward 0.6707, followed by 0.6694.
Consolidation and Pullback
AUD/USD may consolidate near 0.6757 as buyers and sellers compete for control. A failed breakout or bearish rejection would support the downside scenario.
Bullish Alternative
A decisive breakout above 0.6757 would weaken the bearish outlook and expose 0.6778 and 0.6791.
AUD/USD Intraday Forecast Risk Factors and Alternative Outlook
The main risk to short positions is a sustained breakout above 0.6757.
Because price is approaching the pivot, a false breakout or sudden reversal could generate intraday volatility.
Reserve Bank of Australia and Federal Reserve expectations, economic releases, and shifts in global risk sentiment may also influence AUD/USD.
AUD/USD Intraday Forecast Conclusion
The AUD/USD Intraday Forecast remains bearish below 0.6757, targeting 0.6707 and 0.6694.
The approaching pivot represents a critical reversal opportunity. A successful rejection could restore selling pressure, while a breakout would shift attention toward 0.6778 and 0.6791.
FAQ
Is AUD/USD bullish or bearish intraday?
The preferred technical outlook is bearish while AUD/USD remains below 0.6757.
What are AUD/USD’s downside targets?
The primary downside targets are 0.6707 and 0.6694.
Why is 0.6757 important?
It is the critical resistance pivot separating the bearish scenario from a potential bullish reversal.
What could confirm bearish continuation?
A rejection near 0.6757 followed by sustained downward price action could strengthen the bearish outlook.
What happens above 0.6757?
A sustained breakout could trigger a recovery toward 0.6778 and 0.6791.