
NZD/USD Intraday Forecast: Sellers Maintain Control Below 0.5846 Resistance
Introduction
The NZD/USD Intraday Forecast remains bearish as the currency pair continues to trade below the critical resistance level at 0.5846. Technical indicators and recent price action suggest that sellers remain firmly in control, limiting recovery attempts and maintaining downside pressure.
For more forex market updates and trading opportunities, visit:
https://fastpip.com/category/forex-analysis/
Current market conditions favor caution among buyers, while the prevailing trend continues to support bearish positioning below resistance.
NZD/USD Intraday Forecast Technical Analysis
The NZD/USD Intraday Forecast reflects a negative technical structure supported by multiple indicators.
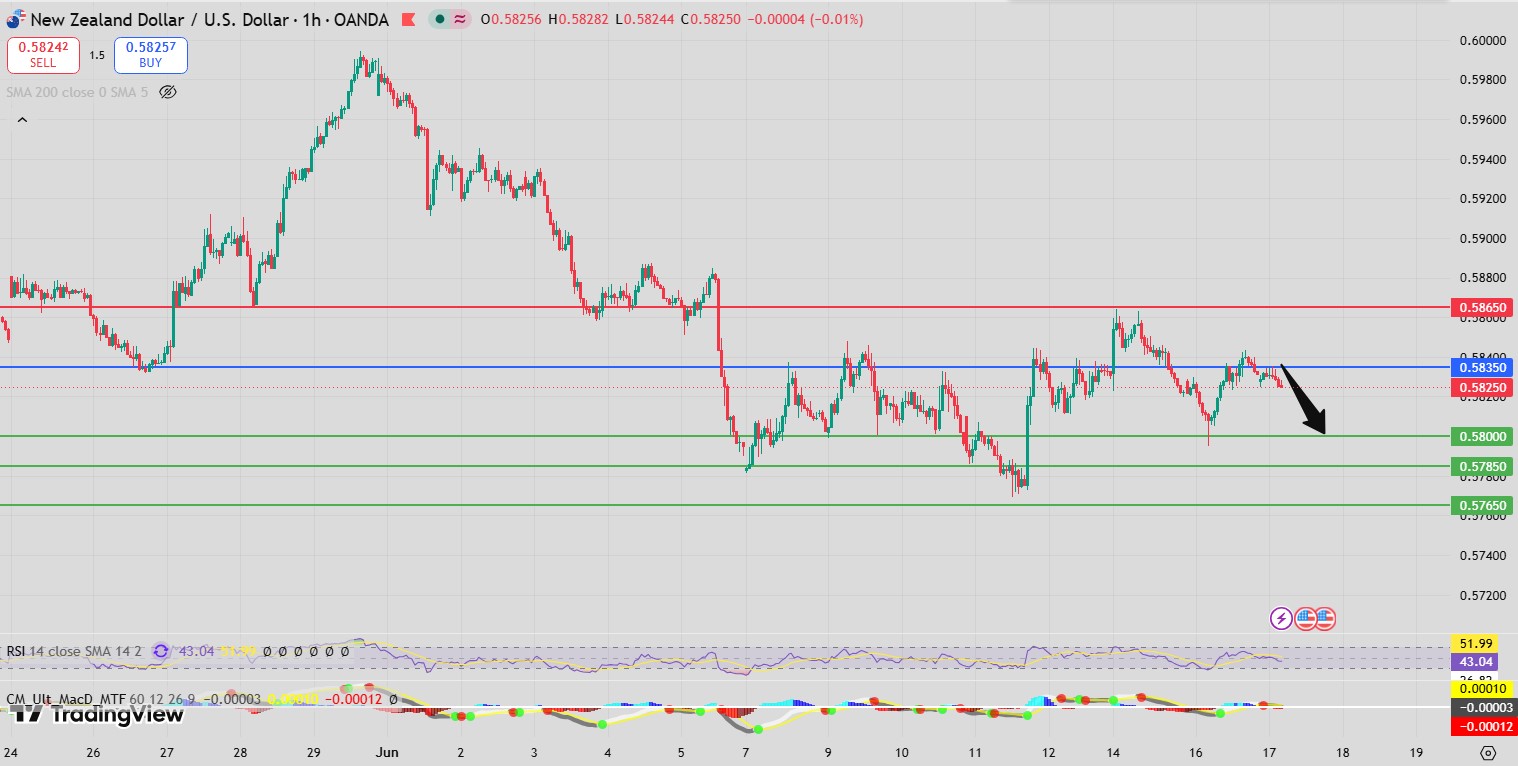
The Relative Strength Index (RSI) remains below its neutrality area at 50, indicating that bearish momentum continues to dominate the market. At the same time, the MACD remains below its signal line and in negative territory, reinforcing the downside outlook.
Price action also remains weak as the pair trades below both the 20-period moving average at 0.5832 and the 50-period moving average at 0.5828. This alignment often signals that short-term and medium-term trends are moving in the same bearish direction.
For monetary policy developments affecting currency markets, traders can monitor:
https://www.federalreserve.gov/
The overall technical picture continues to support the bearish scenario while resistance remains intact.
Market Sentiment Analysis
The NZD/USD Intraday Forecast reflects cautious sentiment toward the New Zealand dollar as traders assess global growth expectations, commodity demand, and interest rate outlooks.
Market participants remain focused on economic developments from major economies, particularly those affecting risk-sensitive currencies such as the New Zealand dollar. Uncertainty surrounding global growth prospects continues to weigh on sentiment.
For global economic outlook reports and forecasts, traders can review:
Current sentiment remains defensive and supports continued downside pressure in the short term.
Support and Resistance Levels
Support and resistance analysis remains crucial to understanding the current market structure.
The primary resistance level is located at 0.5846, which serves as the key pivot in the current setup.
As long as price remains below this level, bearish pressure is expected to persist.
The main downside objective is 0.5785, which represents the next significant support target.
Under the alternative scenario, a break above resistance could expose higher levels at 0.5869 and 0.5882.
Trading Scenario Analysis
According to the NZD/USD Intraday Forecast, short positions remain favored while the pair trades below 0.5846.
The combination of weak momentum indicators, negative MACD readings, and price trading below major moving averages strengthens the bearish case.
If sellers maintain control, the market could gradually decline toward 0.5785 in the coming sessions.
However, a sustained move above the resistance zone would weaken the current bearish structure and shift attention toward recovery targets.
Risk Factors and Alternative Outlook
Despite the bearish outlook, traders should remain aware of potential volatility stemming from economic data releases, central bank communications, and shifts in global market sentiment.
A breakout above 0.5846 would invalidate the preferred bearish scenario and increase the likelihood of gains toward 0.5869 and 0.5882.
Maintaining disciplined risk management remains essential in all market conditions.
Conclusion
The NZD/USD Intraday Forecast remains bearish while price trades below 0.5846. Weak RSI readings, negative MACD signals, and price action below key moving averages continue to support downside expectations.
As long as resistance remains intact, the focus remains on the 0.5785 downside target.
FAQ
What is the current NZD/USD Intraday Forecast?
The forecast remains bearish below 0.5846 with a downside target at 0.5785.
Why is 0.5846 important?
It acts as the main resistance level separating bearish and bullish scenarios.
What does the RSI indicate?
The RSI remains below 50, signaling weak momentum and bearish market conditions.
What does the MACD show?
The MACD remains below its signal line and in negative territory, supporting further downside.
What would invalidate the bearish outlook?
A sustained break above 0.5846 would shift attention toward 0.5869 and 0.5882.