
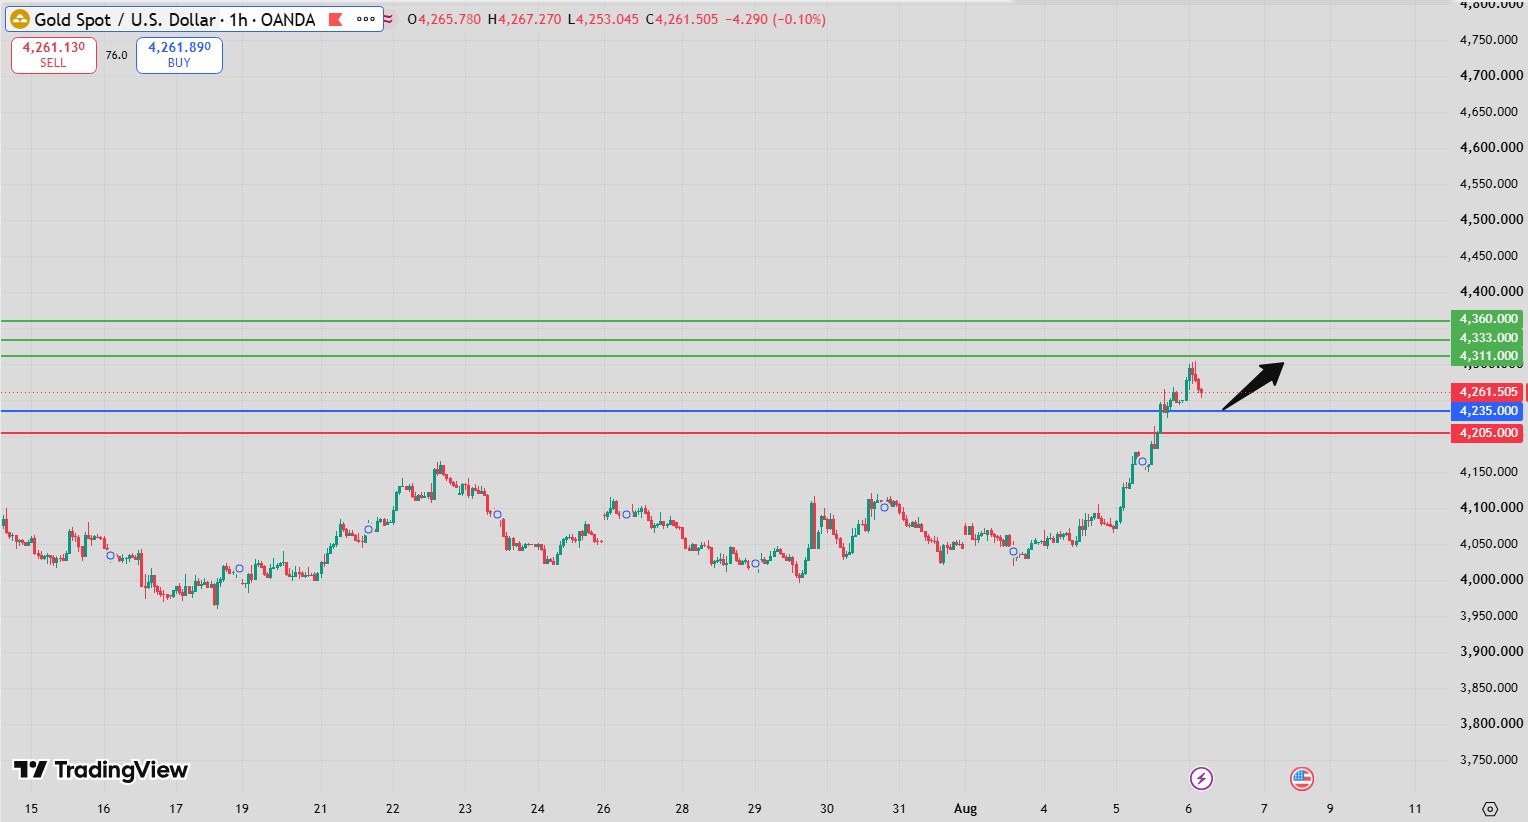
Gold Intraday Forecast: Buyers Target 4,311 and 4,333 While 4,213 Holds
Introduction
The Gold Intraday Forecast remains constructive as gold continues to trade above the important pivot support at 4,213. The overall technical structure favors buyers, with the market targeting 4,311 initially and 4,333 on further strength.
Momentum indicators remain supportive despite minor signs of slowing momentum, suggesting that the broader bullish trend is still intact while prices remain above the pivot.
For more forex and precious metals analysis, visit:
https://fastpip.com/category/forex-analysis/
The latest Gold Intraday Forecast indicates that buyers remain in control, although traders should monitor momentum closely as gold approaches higher resistance levels.
Gold Intraday Forecast Technical Analysis
The Gold Intraday Forecast continues to favor the upside while prices remain above 4,213.
Current technical indicators present a positive market structure:
- The RSI remains above the neutral 50 level, confirming that bullish momentum continues to dominate.
- The MACD is below its signal line but remains in positive territory. This suggests that upside momentum has slowed slightly, but the broader trend has not yet turned bearish.
- Gold is trading above both the 20-period moving average (4,264) and the 50-period moving average (4,215), confirming that both the short-term and medium-term trends remain positive.
Although the MACD signals some moderation in momentum, the alignment of the moving averages and RSI continues to support the bullish outlook.
For updates on monetary policy affecting the gold market, traders can follow:
https://www.federalreserve.gov/
Gold Intraday Forecast Market Sentiment Analysis
The Gold Intraday Forecast reflects continued optimism as investors balance expectations for interest rates, inflation, and global economic conditions.
Gold prices remain influenced by several major factors:
- Federal Reserve interest-rate expectations.
- US dollar performance.
- Treasury yield movements.
- Inflation trends.
- Safe-haven demand.
- Geopolitical uncertainty.
The current technical structure indicates that buyers remain confident while support at 4,213 continues to hold.
For broader economic outlook reports, traders can review:
Overall market sentiment remains positive despite some moderation in short-term momentum.
Gold Intraday Forecast Support and Resistance Levels
Technical levels remain essential for today’s trading outlook.
Pivot Support
The key pivot level is located at:
4,213
As long as gold remains above this level, the bullish scenario remains valid.
Upside Targets
The first bullish objective is:
4,311
If buying momentum continues, the next target becomes:
4,333
These represent the primary objectives within the current Gold Intraday Forecast.
Alternative Scenario
If gold falls below 4,213, the bullish outlook would weaken significantly.
Potential downside targets become:
- 4,175
- 4,152
Gold Intraday Forecast Trading Scenario Analysis
According to the Gold Intraday Forecast, long positions remain favored while prices hold above 4,213.
The bullish case is supported by:
- RSI remaining above 50.
- Price trading above both major moving averages.
- Positive MACD despite short-term weakening.
- Strong technical support at the pivot level.
The current market structure suggests that buyers may continue pushing prices toward 4,311, with 4,333 representing the next upside objective if resistance is successfully broken.
However, traders should monitor MACD closely because weakening momentum could lead to temporary consolidation before another upward move.
For more trading opportunities and daily market updates, visit:
https://fastpip.com/category/market-news/
Gold Intraday Forecast Risk Factors and Alternative Outlook
Although the Gold Intraday Forecast remains bullish, several external factors could quickly change market direction.
Important risks include:
- Strong US economic data.
- Unexpected Federal Reserve policy guidance.
- Rising US Treasury yields.
- A stronger US dollar.
- Increased profit-taking after recent gains.
A sustained break below 4,213 would invalidate the bullish scenario and expose downside levels at 4,175 and 4,152.
Risk management remains essential, particularly as gold approaches higher resistance levels.
Gold Intraday Forecast Conclusion
The Gold Intraday Forecast remains bullish while prices trade above 4,213. The RSI continues to support buyers, the MACD remains positive despite slowing momentum, and price action above both major moving averages confirms the prevailing uptrend.
The preferred scenario targets 4,311 initially, followed by 4,333 if bullish momentum continues. Traders should continue monitoring the 4,213 support level, as it remains the key line separating the bullish and bearish outlooks.
FAQ
What is the current Gold Intraday Forecast?
The forecast remains bullish above 4,213 with upside targets at 4,311 and 4,333.
Why is 4,213 important?
It is the key pivot support that maintains the current bullish technical structure.
What does the RSI indicate?
The RSI is above 50, confirming that bullish momentum remains in control.
Why is the MACD important here?
Although the MACD is below its signal line, it remains positive, suggesting slowing momentum rather than a confirmed trend reversal.
What could invalidate the bullish outlook?
A sustained move below 4,213 would shift the focus toward 4,175 and 4,152.

