
Gold Intraday Forecast: Bullish Above 4,074
Gold Intraday Forecast
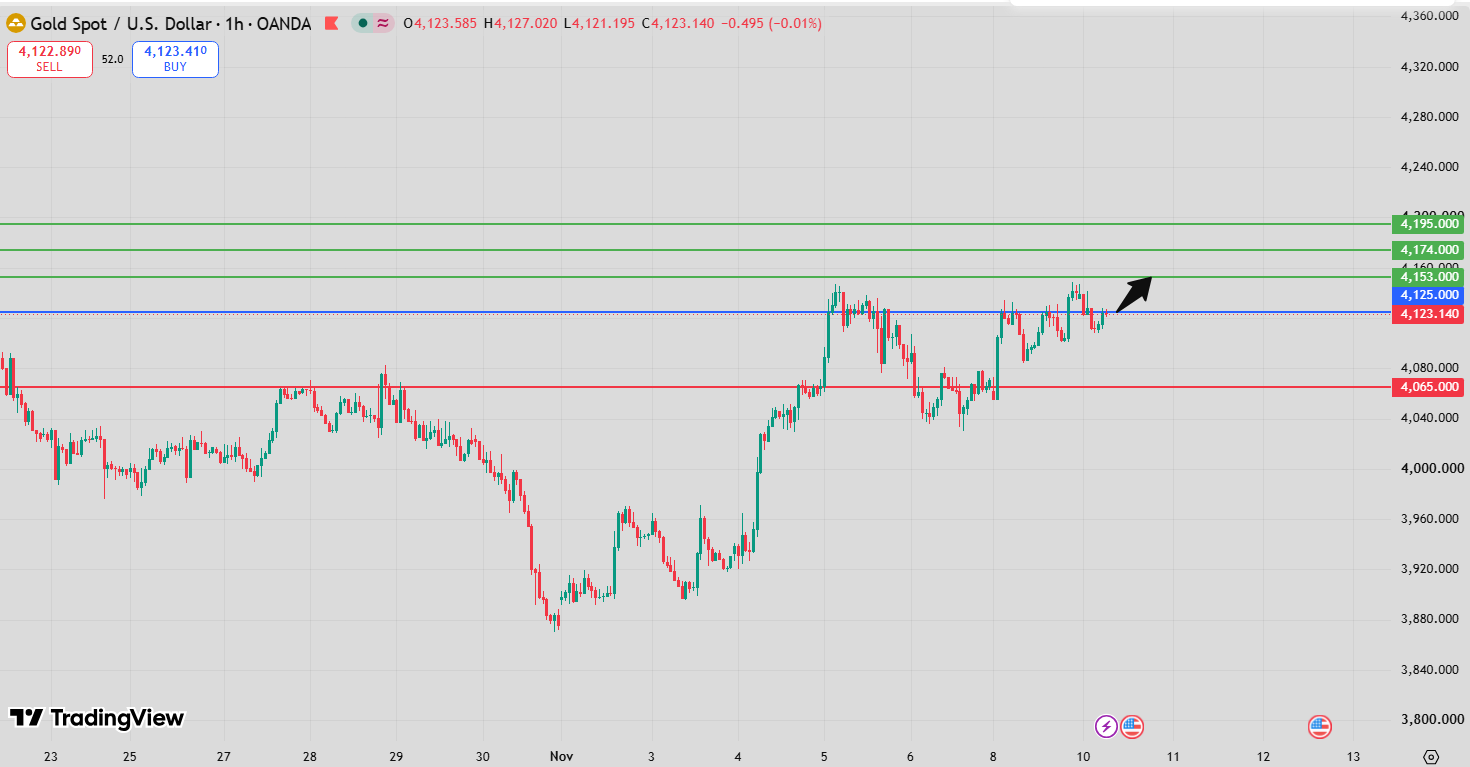
The latest Gold Intraday Forecast maintains a bullish outlook as long as 4,074 holds as support. The primary upside targets are 4,153 and 4,174.
The RSI is above 50, indicating positive momentum. However, gold is trading below its 20-period moving average at 4,131 but above its 50-period moving average at 4,118.
This mixed price positioning suggests that short-term buying momentum may be weakening, although the broader bullish scenario remains valid above the main pivot.
Gold Intraday Forecast Technical Analysis
The technical outlook remains bullish while gold holds above 4,074.
The 20-period moving average at 4,131 represents immediate resistance, while the 50-period moving average at 4,118 provides an important support reference.
The 20-period moving average remains above the 50-period average, indicating that the underlying moving-average alignment is still positive.
A sustained recovery above 4,131 could strengthen buying momentum and support an advance toward 4,153, followed by 4,174.
Conversely, a decline below 4,118 could increase selling pressure and bring the main pivot at 4,074 into focus.
A decisive breakdown below 4,074 would weaken the bullish outlook and expose 4,039 and 4,019.
Traders can follow broader market developments through FastPip and scheduled economic events on the Forex Factory economic calendar.
Gold Intraday Forecast Market Sentiment Analysis
Market sentiment remains cautiously bullish, supported by the RSI above its neutral level.
However, price trading below the 20-period moving average suggests that immediate buying pressure has moderated.
A successful defense of the 4,118 support area could encourage renewed buying interest and another attempt toward 4,153.
Recovery above 4,131 would provide additional support for the bullish scenario.
Conversely, a sustained decline below both moving averages could weaken sentiment and increase the probability of testing the 4,074 pivot.
Gold Intraday Forecast Support and Resistance Levels
| Level | Price | Significance |
|---|---|---|
| Pivot support | 4,074 | Bullish invalidation |
| 20-period MA | 4,131 | Immediate resistance |
| 50-period MA | 4,118 | Intermediate support |
| Target A | 4,153 | First bullish target |
| Target B | 4,174 | Second bullish target |
| Target C | 4,195 | Suggested extension |
| Alternative A | 4,039 | First bearish target |
| Alternative B | 4,019 | Second bearish target |
Gold Intraday Forecast Trading Scenario Analysis
Bullish Continuation
Holding above 4,074 preserves the bullish outlook. A sustained recovery above 4,131 could support an advance toward 4,153 and 4,174.
Consolidation and Pullback
Gold may consolidate between the moving averages at 4,118 and 4,131. A successful defense of the lower average could encourage another recovery attempt.
Bearish Alternative
A decisive breakdown below 4,074 would weaken the bullish scenario and expose 4,039 and 4,019.
Gold Intraday Forecast Risk Factors and Alternative Outlook
The main risk is a sustained decline below the 50-period moving average at 4,118, which could increase the probability of testing the pivot.
Although the RSI remains positive, gold trading below its 20-period moving average indicates that immediate momentum is not fully aligned with the bullish outlook.
US dollar movements, Treasury yields, Federal Reserve expectations, and unexpected economic announcements may also influence gold prices.
Gold Intraday Forecast Conclusion
The Gold Intraday Forecast remains bullish above 4,074, targeting 4,153 and 4,174.
The RSI supports the upside, but price must overcome the 20-period moving average at 4,131 to strengthen the immediate bullish structure.
A breakdown below 4,074 would shift the outlook toward 4,039 and 4,019.
FAQ
Is gold bullish or bearish intraday?
The preferred outlook is bullish while gold remains above 4,074.
What are gold’s upside targets?
The primary targets are 4,153 and 4,174.
What does the RSI indicate?
The RSI is above 50, suggesting positive market momentum.
What do the moving averages indicate?
Gold trades below its 20-period MA at 4,131 but above its 50-period MA at 4,118, indicating mixed short-term conditions.
What happens below 4,074?
A sustained breakdown could trigger declines toward 4,039 and 4,019.