
GBP/USD Intraday Forecast: Downside Toward 1.3463 and 1.3451 While 1.3515 Holds
Introduction
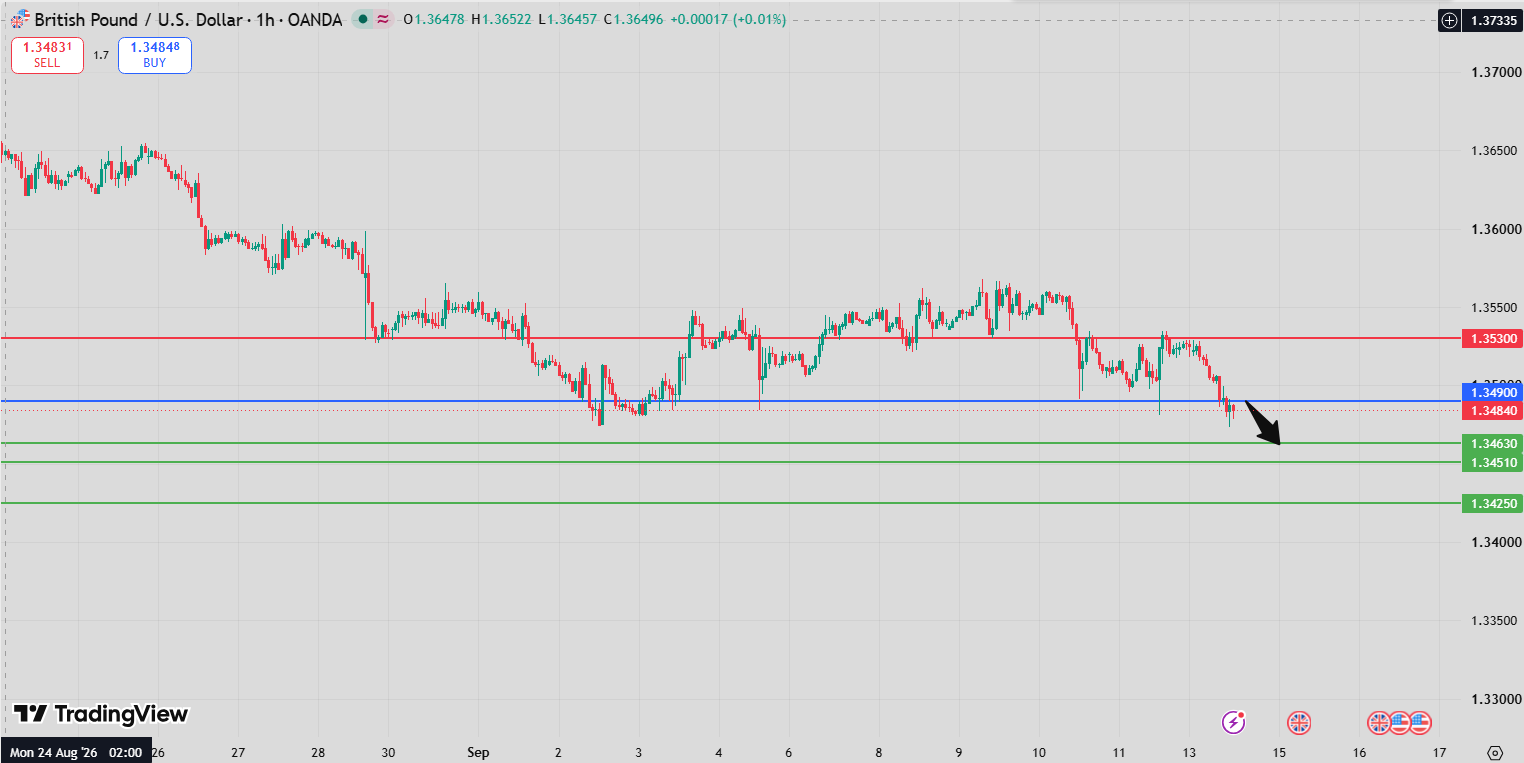
The latest GBP/USD Intraday Forecast remains bearish as long as 1.3515 continues to act as resistance. The immediate downside targets are 1.3463 and 1.3451, keeping sellers in control while the pair remains below the key pivot.
The technical picture strongly favors downside momentum, with RSI below 30, MACD below its signal line and in negative territory, and price trading below both the 20-period and 50-period moving averages. However, the deeply oversold RSI and price below the lower Bollinger Band increase the possibility of a short-term corrective rebound.
GBP/USD Intraday Forecast Technical Analysis
GBP/USD is under clear short-term pressure below the 1.3515 pivot. This level is also aligned with the 50-period moving average, making it an important resistance zone for any attempted recovery.
Momentum indicators remain bearish. RSI is below 30, confirming significant downside pressure but also warning that the pair may be entering oversold territory. The MACD is below its signal line and remains negative, indicating that bearish momentum is still dominant.
The moving-average structure adds confirmation to the bearish outlook. Price is below the 20-period moving average at 1.3508 and the 50-period moving average at 1.3515. As long as GBP/USD remains beneath these levels, recovery attempts may continue to attract sellers.
Another important technical signal is the position below the lower Bollinger Band at 1.3483. Trading below the lower band reflects strong downside momentum, although it can also precede a temporary mean-reversion move.
GBP/USD Intraday Forecast Market Sentiment Analysis
Market sentiment remains bearish while GBP/USD trades below 1.3515. Sellers have the technical advantage because momentum indicators, moving averages and Bollinger Band positioning are all pointing toward continued pressure.
The first downside objective is 1.3463. As price approaches this target, traders may begin taking profits, potentially creating a short-term rebound or consolidation.
However, the oversold RSI means that downside continuation should be monitored carefully. If bullish divergence develops while price approaches the targets, the probability of a corrective recovery would increase.
A decisive break above 1.3515 would provide the clearest signal that bearish momentum is losing strength and would shift attention toward the alternative targets at 1.3535 and 1.3548.
GBP/USD Intraday Forecast Support and Resistance Levels
Key Pivot Resistance: 1.3515
The 1.3515 level is the primary pivot and resistance. Remaining below this area keeps the bearish scenario active.
First Downside Target: 1.3463
The first bearish objective is 1.3463. A move toward this level could attract profit-taking.
Second Downside Target: 1.3451
If sellers maintain control below 1.3463, the next objective becomes 1.3451.
Alternative Upside Target: 1.3535
A decisive break above 1.3515 would open the alternative upside path toward 1.3535.
Second Alternative Upside Target: 1.3548
Continued buying pressure above 1.3535 could extend the recovery toward 1.3548.
Key levels:
- Pivot / Resistance: 1.3515
- Target A: 1.3463
- Target B: 1.3451
- Alternative Target A: 1.3535
- Alternative Target B: 1.3548
- 20-period MA: 1.3508
- 50-period MA: 1.3515
- Lower Bollinger Band: 1.3483
GBP/USD Intraday Forecast Trading Scenario Analysis
Bearish Scenario
The primary scenario remains bearish below 1.3515. Continued rejection from the pivot would keep sellers in control and maintain the path toward 1.3463.
If selling pressure persists through 1.3463, GBP/USD could extend the decline toward 1.3451. The negative MACD and bearish moving-average structure support this continuation scenario.
Oversold Pullback Scenario
The RSI below 30 creates a significant possibility of a short-term corrective rebound. Trading below the lower Bollinger Band at 1.3483 also suggests that the pair may temporarily move back inside the Bollinger range.
Such a rebound could target the 1.3508–1.3515 area. However, unless GBP/USD breaks and holds above 1.3515, the recovery should be considered corrective rather than a confirmed trend reversal.
Bullish Alternative Scenario
The alternative scenario becomes active if GBP/USD decisively breaks above 1.3515. Such a move would weaken the current bearish structure and could open the way toward 1.3535.
If buyers maintain momentum above 1.3535, the next upside objective would be 1.3548. This scenario would indicate that sellers are losing control of the short-term trend.
GBP/USD Intraday Forecast Risk Factors and Alternative Outlook
The main risk for sellers is the oversold technical condition. RSI below 30 can occur during strong downtrends, but it can also precede a sharp corrective rebound, particularly if bullish divergence develops.
Trading below the lower Bollinger Band at 1.3483 is another warning sign. While it confirms strong downside momentum, prolonged moves outside the band can eventually lead to mean reversion.
The key invalidation level remains 1.3515. A decisive recovery above this pivot would weaken the bearish setup and increase the probability of an advance toward 1.3535 and 1.3548.
GBP/USD Intraday Forecast Conclusion
The current GBP/USD Intraday Forecast remains bearish while 1.3515 holds as resistance. The immediate downside target is 1.3463, followed by 1.3451 if selling pressure continues.
RSI below 30, negative MACD and price below both moving averages support the bearish structure. Nevertheless, the oversold RSI and price below the lower Bollinger Band create a meaningful risk of a temporary pullback. A sustained break above 1.3515 would invalidate the immediate bearish scenario and shift focus toward 1.3535 and 1.3548.
FAQ
Is the GBP/USD Intraday Forecast bearish?
Yes. The short-term outlook remains bearish while GBP/USD stays below 1.3515.
What is the first target for GBP/USD?
The first downside target is 1.3463.
What is the second downside target?
The second target is 1.3451 if selling pressure continues.
Is GBP/USD oversold?
Yes. RSI is below 30, indicating an oversold condition. This can occur during a strong downtrend but may also increase the risk of a corrective rebound.
When does the bearish scenario become invalid?
A decisive break and sustained move above 1.3515 would weaken and potentially invalidate the current bearish setup.

