Signal Provider Performance Evaluation: Key Metrics That Matter
Signal Provider Performance Evaluation: Key Metrics That Matter
A profitable month does not automatically prove that a trading signal service is good.
A high Win Rate does not automatically prove that a strategy is sustainable.
And a large return does not tell you how much risk was required to achieve it.
This is why signal provider performance evaluation requires much more than counting winning trades.
Professional signal providers should evaluate their systems using a combination of:
- Win Rate
- Risk-to-Reward Ratio
- Average Win
- Average Loss
- Expectancy
- Maximum Drawdown
- Return
- Sample Size
- Backtesting
- Forward Testing
- Risk-adjusted performance
- Benchmark comparison
- Risk management
- Transparent reporting
The purpose is not merely to answer:
“Did the signals make money?”
The real question is:
“How was that performance achieved, how much risk was taken, and can the process remain sustainable over time?”
This distinction is fundamental.
A service may generate excellent short-term profits while using excessive leverage.
Another service may generate lower returns but maintain significantly lower Drawdown and more consistent risk.
From a professional perspective, these are very different performance profiles.
CFA Institute describes performance evaluation as a process that goes beyond measuring return alone and includes understanding how results were generated, what risks were taken, how benchmarks are used, and what limitations exist in the underlying data.
That same principle is highly relevant when evaluating trading signal services.
What Is Signal Provider Performance Evaluation?
Signal provider performance evaluation is the structured process of measuring how effectively a trading signal service performs over time.
It uses historical and live trading data to determine whether signals are:
- Profitable
- Consistent
- Risk-controlled
- Statistically meaningful
- Repeatable
For example, suppose a service publishes:
100 trading signals in one month
and the results are:
65 winners
35 losers
At first glance, the obvious metric is:
65% Win Rate
But professional evaluation should go further.
You also need to know:
- How large were the winning trades?
- How large were the losing trades?
- What was the Maximum Drawdown?
- What was the risk per trade?
- Were results consistent across the month?
- Did one exceptional trade create most of the profit?
Without those answers, Win Rate alone provides an incomplete picture.
Why Performance Measurement Matters
A trading strategy can change over time.
Market conditions change.
Volatility changes.
Liquidity changes.
Correlations change.
A strategy that worked extremely well six months ago may gradually lose effectiveness.
Continuous evaluation helps identify those changes.
For example:
Previous three-month Win Rate:
65%
Current month:
49%
This does not automatically mean the strategy has failed.
But it deserves investigation.
Performance measurement acts as a monitoring system.
It can reveal:
- Strategy deterioration
- Changing market conditions
- Increasing Drawdown
- Reduced expectancy
- Risk-management problems
Without systematic measurement, these changes may remain hidden until losses become much larger.
Profitability Is Not the Same as Good Performance
One of the most common mistakes in signal evaluation is looking only at profit.
Imagine two providers.
Provider A
Monthly Return: +20%
Maximum Drawdown: 8%
Provider B
Monthly Return: +20%
Maximum Drawdown: 55%
Both earned the same return.
They did not deliver the same quality of performance.
Provider B exposed followers to dramatically greater risk.
Professional evaluation therefore needs to answer two separate questions:
How much return was generated?
and:
How much risk was required to generate it?
CFA Institute emphasizes this distinction in professional portfolio evaluation: performance appraisal should consider both results and the investment process used to generate them. CFA Institute – Portfolio Performance Evaluation
Win Rate in Signal Provider Performance Evaluation
Win Rate is one of the best-known trading statistics.
Formula:
Winning Trades ÷ Total Trades × 100
Example:
100 total trades
65 winners
Win Rate:
65%
This tells you how frequently the strategy produced winning trades.
But it does not tell you how profitable the strategy was.
Is a High Win Rate Always Better?
No.
Consider:
System A
Win Rate: 80%
Average Winner: +$100
Average Loser: -$500
Across ten trades:
8 winners = +$800
2 losses = -$1,000
Net result:
-$200
Now consider:
System B
Win Rate: 50%
Average Winner: +$300
Average Loser: -$100
Across ten trades:
5 winners = +$1,500
5 losses = -$500
Net result:
+$1,000
System B has the lower Win Rate.
But much stronger expectancy.
This is why Win Rate should never be evaluated alone.
Risk-to-Reward Ratio
Risk-to-Reward compares potential loss with potential gain.
Example:
Risk:
$100
Target Profit:
$300
Risk-to-Reward:
1:3
This means the strategy risks one unit to potentially earn three.
Why Risk-to-Reward Matters
A strategy does not need an extremely high Win Rate if winners are significantly larger than losers.
For example:
Win Rate: 45%
Risk-to-Reward:
1:3
can potentially perform better than:
Win Rate: 80%
Risk-to-Reward:
1:0.5
This is why professional signal providers should evaluate Win Rate and Risk/Reward together.
Average Winner and Average Loser
Another important metric is the average size of winning and losing trades.
Suppose:
Average Winner:
+2R
Average Loser:
-1R
This relationship can create positive expectancy even if fewer than half of trades win.
Why Average Trade Size Matters
Consider two strategies with identical Win Rates.
Strategy A
Win Rate: 60%
Average Win: +$200
Average Loss: -$100
Strategy B
Win Rate: 60%
Average Win: +$80
Average Loss: -$300
Their Win Rates are identical.
Their financial quality is completely different.
Expectancy: One of the Most Important Metrics
Expectancy estimates how much a strategy statistically expects to gain or lose per trade over a large sample.
A simplified formula is:
Expectancy = (Win Rate × Average Win) − (Loss Rate × Average Loss)
Suppose:
Win Rate: 60%
Average Winner: +$200
Loss Rate: 40%
Average Loss: -$100
Expectancy:
(0.60 × 200) − (0.40 × 100)
= 120 − 40
= +$80 per trade
This means that over a sufficiently large sample, each trade contributes approximately $80 of expected value.
Positive Expectancy Does Not Mean Every Trade Wins
This is important.
Positive expectancy means the system has a statistical advantage over many trades.
It does not mean:
- Every week will be profitable
- Every month will be profitable
- Losing streaks will disappear
A professional evaluation must therefore consider both expectancy and variability.
Maximum Drawdown
Maximum Drawdown measures the largest decline from a previous equity peak.
Example:
Account Peak:
$15,000
Later Equity Low:
$12,000
Drawdown:
20%
Maximum Drawdown is one of the most important metrics in signal provider performance evaluation because it shows the actual downside experienced by the strategy.
Why Drawdown Can Matter More Than Return
Imagine:
Service A
Return: +35%
Max Drawdown: 9%
Service B
Return: +40%
Max Drawdown: 48%
Service B earned slightly more.
But the risk profile is dramatically more aggressive.
A user choosing purely based on return might miss this completely.
Drawdown Also Measures Psychological Pressure
Drawdown is not only a mathematical metric.
It represents the real experience of followers.
A 10% Drawdown may be manageable.
A 50% Drawdown can cause:
- Panic
- Account abandonment
- Reduced position size
- Emotional decision-making
That is why high returns cannot be evaluated independently from Drawdown.
Return Rate
Return measures the percentage change in account value over a period.
Example:
Starting Balance:
$10,000
Ending Balance:
$12,000
Return:
20%
Return can be calculated for:
- Daily periods
- Weekly periods
- Monthly periods
- Quarterly periods
- Annual periods
Return Must Always Be Evaluated With Risk
Two providers may both deliver:
+25% annual return
But one may achieve it with:
10% Drawdown
while another requires:
60% Drawdown.
Return without risk context tells only half the story.
Evaluate Performance Across Different Time Periods
A strong month is not enough.
Professional providers should review:
- Weekly performance
- Monthly performance
- Quarterly performance
- Annual performance
The objective is to determine whether the system works across changing market environments.
Why Short-Term Results Can Mislead
A strategy may perform extremely well during:
- Strong trends
- High volatility
and struggle during:
- Range-bound markets
- Low volatility
If you evaluate only its best month, the results may appear much stronger than long-term reality.
Sample Size Matters
A performance statistic becomes more useful when it is based on a meaningful number of trades.
Consider:
Sample A
9 wins from 10 trades
Win Rate:
90%
Sample B
600 wins from 1,000 trades
Win Rate:
60%
The 90% number looks better.
But the 1,000-trade sample provides far more information about repeatability.
Small Samples Are Vulnerable to Luck
A strategy can easily experience:
- 8 winners from 10 trades
- 9 winners from 10 trades
through short-term randomness.
As the sample grows, luck has less influence on the overall statistics.
Analyze Winning and Losing Trades Separately
Professional providers do not only count wins and losses.
They study them.
Questions may include:
- Which instruments perform best?
- Which trading session creates most losses?
- Do losses cluster around economic news?
- Does performance decline during low volatility?
- Are certain setups consistently weak?
This type of analysis can reveal weaknesses that headline statistics cannot.
Losing Trades Can Provide More Information Than Winners
Winning trades confirm that the strategy can work.
Losing trades often reveal:
- Poor entries
- Weak filters
- Excessive Stop Loss distance
- Market-regime problems
This is why serious providers should analyze losing trades rather than hide them.
Backtesting
Backtesting applies trading rules to historical market data to see how the strategy would have performed.
A backtest can help estimate:
- Win Rate
- Drawdown
- Risk-to-Reward
- Expectancy
- Profit Factor
- Trade frequency
before the strategy is used live.
Why Backtesting Is Valuable
It allows developers to test a strategy across:
- Bull markets
- Bear markets
- Trending markets
- Range markets
- Different volatility conditions
without waiting years for live data.
Backtesting Has Limitations
Historical performance does not guarantee future results.
Problems can arise from:
- Overfitting
- Poor historical data
- Unrealistic execution assumptions
- Ignoring spread
- Ignoring Slippage
A strong backtest therefore needs realistic assumptions.
Forward Testing
Forward testing evaluates the strategy on new, live market data.
This is important because backtesting only tests the past.
Forward testing asks:
Does the strategy still work when the market data is genuinely new?
Backtest vs. Forward Test
| Backtest | Forward Test |
|---|---|
| Historical data | Live/future data |
| Fast evaluation | Takes real time |
| Easy strategy comparison | Tests real execution |
| Can suffer from overfitting | Reveals practical weaknesses |
| Simulated conditions | More realistic market conditions |
Both should ideally be used together.
Forward Testing Can Reveal Execution Problems
A strategy may look excellent historically but perform worse live because of:
- Spread
- Slippage
- Execution latency
- Signal-delivery delays
These issues often appear only when a strategy interacts with the live market.
Sharpe Ratio and Risk-Adjusted Performance
Professional evaluation should also ask:
How much return was achieved for the risk taken?
The Sharpe Ratio is one commonly used risk-adjusted performance metric.
Conceptually, it compares excess return with volatility.
A higher Sharpe Ratio generally suggests that more return was generated for each unit of volatility.
CFA Institute lists the Sharpe Ratio among widely used risk-adjusted performance measures and emphasizes that such ratios need to be interpreted within the appropriate context. CFA Institute – Risk-Adjusted Performance Measures
Example
Two strategies return:
30% per year
But:
Strategy A
Very high volatility
Strategy B
More stable returns
Strategy B may have the stronger risk-adjusted performance even though headline return is identical.
Benchmark Comparison
A provider should also consider whether its strategy adds value relative to an appropriate Benchmark.
Suppose:
Signal Strategy Return:
+20%
Relevant Market Benchmark:
+27%
The strategy made money.
But it underperformed the market.
This raises an important question:
Was following the signal strategy actually worthwhile?
Choose the Right Benchmark
The Benchmark must be relevant.
Examples might include:
- A market index
- A simple buy-and-hold strategy
- A comparable trading model
- A relevant asset
Comparing a crypto signal system with an unrelated equity benchmark would provide limited value.
CFA Institute notes that benchmark quality is essential to meaningful performance evaluation and that a poorly chosen benchmark can distort appraisal results. CFA Institute – Portfolio Performance Evaluation
Risk Management Is Part of Performance
A signal service can have excellent entries and still perform poorly if risk is unmanaged.
Professional risk controls may include:
- Position sizing
- Stop Loss
- Maximum risk per trade
- Maximum daily loss
- Portfolio exposure limits
- Correlation limits
Risk management directly affects:
- Drawdown
- Expectancy
- Account survival
- Return stability
High Return With Poor Risk Management Is Not High-Quality Performance
Suppose a strategy returns:
+100%
but at one point experiences:
-80% Drawdown
That result may look impressive in marketing.
Professionally, the risk profile is extreme.
This is why performance evaluation must include both return and risk.
Common Errors in Signal Performance Reports
Signal reports can become misleading even without outright fabrication.
Common problems include:
- Selective Reporting
- Missing losing trades
- Cherry-picked time periods
- No Drawdown
- No transaction costs
- No Slippage
- No clear methodology
Investor.gov warns that performance claims can be presented in different ways and recommends understanding both what is included and what is omitted from calculations. Investor.gov – Performance Claims
Selective Reporting Is Particularly Dangerous
Suppose a service completes:
100 trades
but reports only:
30 profitable trades
The visible history can appear extraordinary.
The underlying performance may be very different.
This is exactly why complete datasets matter.
Link Performance Evaluation to Raw Trade Data
Every reported metric should ideally be traceable back to individual trades.
For each signal, record:
- Date
- Symbol
- Direction
- Entry
- Stop Loss
- Take Profit
- Exit
- Result
- Risk
- Execution notes
This creates the foundation for reliable performance statistics.
Use a Trading Journal
A structured journal makes performance evaluation far easier.
FastPip’s Trading Journal guide explains how recording entry time, position size, entry and exit points, results, and trade rationale helps traders identify patterns and improve their process.
FastPip – Trading Journal Writing
This is equally useful for signal providers.
Different Trading Styles Need Different Evaluation
A scalping service may generate:
500 trades per month.
A swing-trading provider may generate:
Their performance should not be evaluated identically.
FastPip’s Trading Types guide explains how Scalping, Day Trading, Swing Trading and Position Trading differ in timeframe, trade frequency and monitoring requirements.
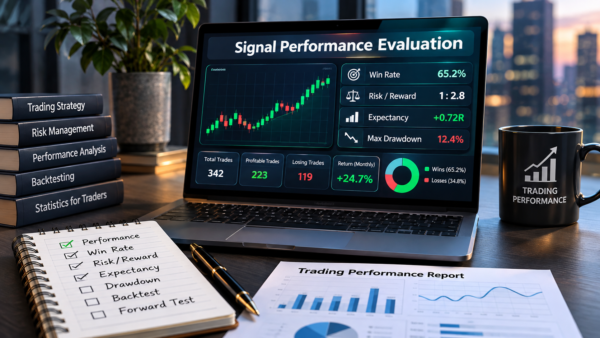
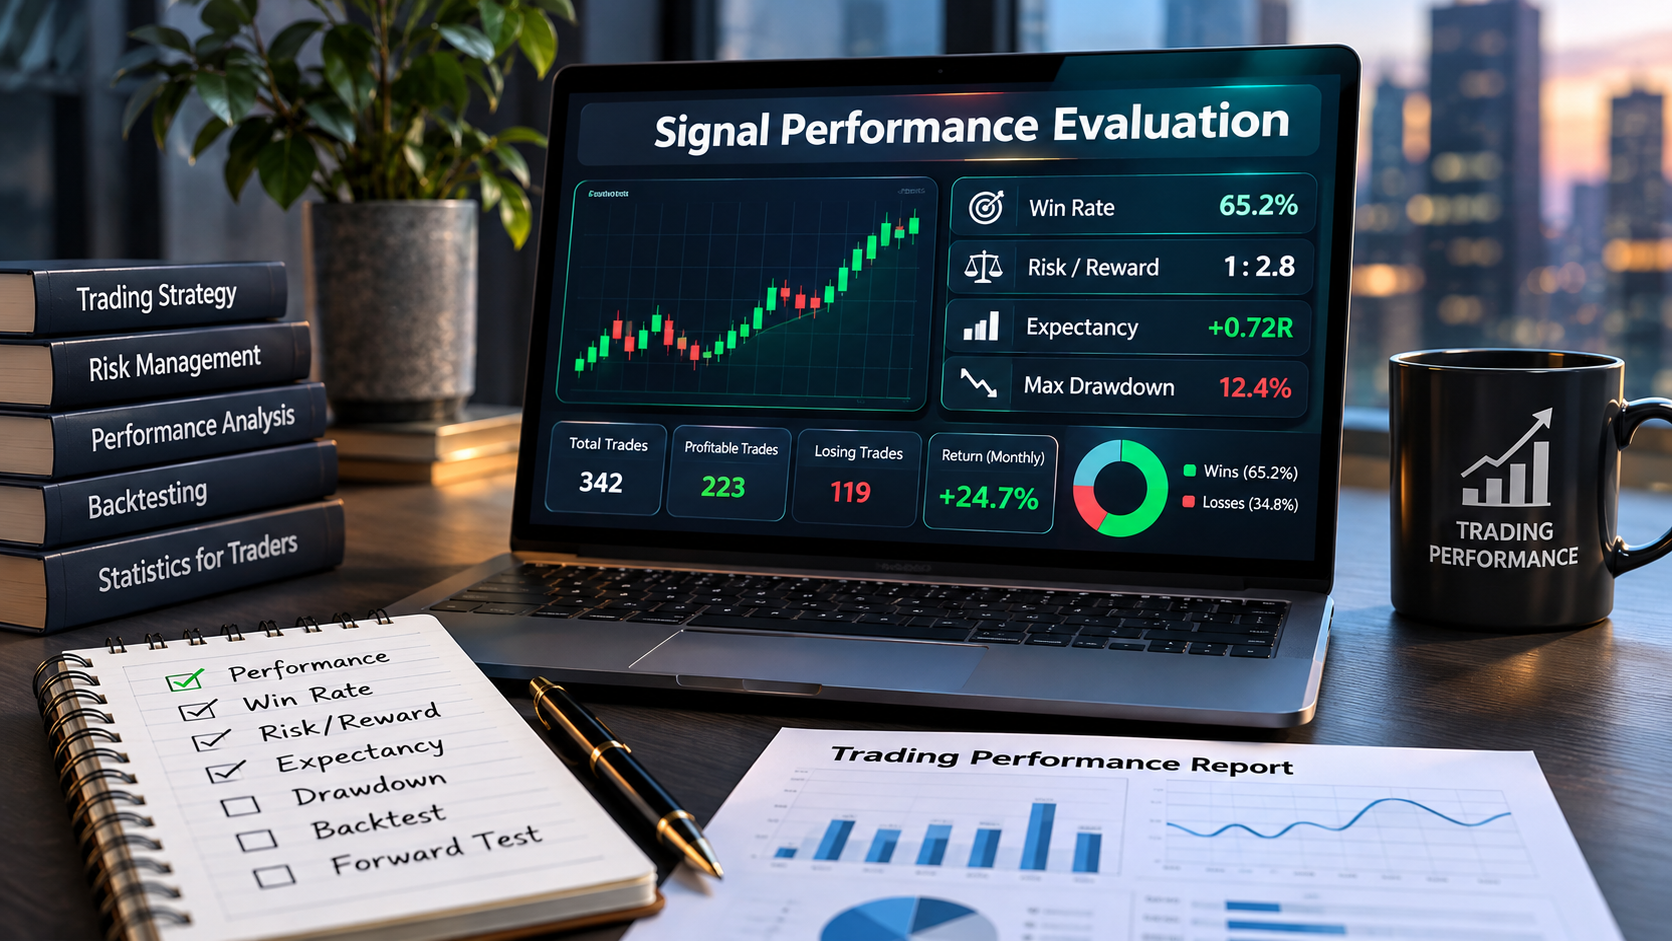
Signal Provider Performance Evaluation Dashboard
A professional dashboard might include:
| Metric | Result |
|---|---|
| Total Trades | 500 |
| Win Rate | 62% |
| Average Win | +1.7R |
| Average Loss | -1R |
| Expectancy | +0.67R |
| Maximum Drawdown | 11% |
| Annual Return | 32% |
| Profit Factor | 1.8 |
| Sharpe Ratio | 1.4 |
This provides far more useful information than:
“92% accuracy!”
How Often Should Performance Be Reviewed?
Different metrics can be reviewed at different frequencies.
Daily
Monitor:
- Execution errors
- Risk violations
- Unusual losses
Weekly
Review:
- Signal quality
- Trade distribution
- Risk exposure
Monthly
Calculate:
- Win Rate
- Expectancy
- Return
- Drawdown
Quarterly
Review:
- Strategy effectiveness
- Market-regime performance
- Benchmark comparison
- System changes
Performance Evaluation Should Detect Strategy Deterioration
Suppose historical results were:
Win Rate: 65%
Expectancy: +0.8R
Drawdown: 10%
Recent results:
Win Rate: 48%
Expectancy: +0.1R
Drawdown: 22%
One metric alone might not justify concern.
Together, they may indicate meaningful deterioration.
That is why multiple metrics should be analyzed together.
Avoid Overreacting to Short-Term Losses
Professional evaluation should not cause constant strategy changes.
Three losing trades do not necessarily mean:
The strategy is broken.
Performance should be compared with expected statistical behavior.
If historical data shows that six consecutive losses sometimes occur, four losses may still be within normal variation.
Benchmark Yourself Against the Strategy, Not Against Emotion
Providers should define expected ranges.
For example:
Expected Win Rate:
55%–65%
Historical Maximum Drawdown:
12%
Expected Monthly Trade Count:
40–60
This creates objective boundaries.
Without benchmarks, every losing week can feel like a crisis.
Transparency Builds Long-Term Trust
Professional reporting should include both:
Success
and:
Failure
Users should be able to see:
- Profitable trades
- Losing trades
- Drawdowns
- Performance periods
- Methodology
Transparency is more sustainable than creating unrealistic expectations.
What Should a Professional Signal Report Include?
A strong report may contain:
Core Performance
- Total Return
- Monthly Return
- Cumulative Return
Trade Statistics
- Total Trades
- Winners
- Losers
- Win Rate
Risk
- Maximum Drawdown
- Risk per Trade
- Average Loss
Quality
- Expectancy
- Profit Factor
- Sharpe Ratio
Context
- Period
- Strategy
- Markets
- Benchmark
Signal Provider Performance Evaluation Checklist
Use this checklist when reviewing a service.
1. Is the Total Trade Count Available?
Small samples provide weaker evidence.
2. Are Both Winners and Losers Included?
Avoid selected histories.
3. Is Win Rate Reported?
Useful, but never alone.
4. Is Average Win Reported?
This shows reward quality.
5. Is Average Loss Reported?
This shows downside.
6. Is Risk-to-Reward Clear?
Understand trade structure.
7. Is Expectancy Positive?
This provides a broader statistical view.
8. Is Maximum Drawdown Available?
Essential for risk evaluation.
9. Are Returns Shown Across Multiple Periods?
Avoid short-term bias.
10. Is the Sample Size Meaningful?
More observations improve reliability.
11. Is Backtesting Available?
Historical testing can reveal strategy behavior.
12. Has Forward Testing Been Performed?
Live-market validation matters.
13. Are Risk-Adjusted Metrics Used?
Sharpe or similar measures can improve analysis.
14. Is a Relevant Benchmark Used?
Performance should be compared appropriately.
15. Is Reporting Transparent?
Complete data matters more than impressive marketing.
Why No Single Metric Is Enough
This may be the most important lesson.
Win Rate can mislead.
Return can mislead.
Sharpe Ratio can have limitations.
Drawdown does not explain everything.
Even Expectancy depends on sample quality.
Professional evaluation therefore requires:
Multiple Metrics + Complete Data + Context
CFA Institute similarly emphasizes that manager skill should be evaluated using a broad range of analytical tools rather than relying on one performance measure alone.
Conclusion: How Professional Signal Providers Evaluate Performance
Effective signal provider performance evaluation goes far beyond asking whether a trading system made money.
Professional evaluation examines:
- Win Rate
- Risk-to-Reward
- Average Winner
- Average Loser
- Expectancy
- Maximum Drawdown
- Return
- Sample Size
- Backtesting
- Forward Testing
- Sharpe Ratio
- Benchmark Performance
- Risk Management
- Transparency
The key principle is:
Return without risk is incomplete.
And:
Win Rate without context is incomplete.
A high-quality signal service should be able to explain not only:
How much it earned
but also:
How it earned it.
The strongest evaluation framework therefore combines:
Profitability + Risk + Consistency + Statistical Validity + Transparency
This allows providers to identify weaknesses, improve strategies, monitor deterioration, and report results more professionally.
For users, the same framework makes it much easier to distinguish a genuinely robust signal service from one that simply presents attractive headline numbers.
Frequently Asked Questions
What is signal provider performance evaluation?
Signal provider performance evaluation is the structured process of measuring a signal service using return, Win Rate, risk, Drawdown, Expectancy and other statistical metrics.
Is Win Rate the most important signal metric?
No. Win Rate is useful but should be analyzed together with average wins, average losses, Risk/Reward, Expectancy and Drawdown.
What is a good Win Rate for a signal provider?
There is no universal ideal percentage. A lower Win Rate can still be profitable if winning trades are significantly larger than losing trades.
What is Expectancy in trading?
Expectancy estimates the average amount a trading strategy statistically expects to gain or lose per trade over a sufficiently large sample.
Why is Maximum Drawdown important?
Maximum Drawdown shows the largest historical decline from an equity peak and helps measure the real downside risk of the strategy.
Is high return enough to prove signal quality?
No. Return should always be evaluated together with risk and Drawdown.
What is the role of sample size?
Larger trade samples generally provide more reliable information about strategy performance and reduce the influence of short-term randomness.
What is backtesting?
Backtesting applies trading rules to historical market data to estimate how the strategy would have performed in the past.
What is forward testing?
Forward testing evaluates a strategy using new, live market data to determine whether backtested results remain realistic.
Is a good backtest enough?
No. Backtesting should ideally be complemented by forward testing and live execution analysis.
What is the Sharpe Ratio?
The Sharpe Ratio is a risk-adjusted performance metric that compares excess return with volatility.
Why should signal providers use a Benchmark?
A Benchmark helps determine whether the strategy added value relative to an appropriate market or alternative strategy.
Why should losing trades be analyzed?
Losses can reveal weaknesses in strategy rules, market conditions, risk controls or execution.
How often should a signal provider evaluate performance?
Monitoring should be continuous, while detailed statistical evaluation can be performed weekly, monthly and quarterly depending on trading frequency.
What is the most important factor in professional signal reporting?
Transparency. Users should be able to evaluate complete performance, including both winners and losers, risk, Drawdown and the relevant time period.