How to Detect Fake Trading Signal Statistics and Manipulated Performance
How to Detect Fake Trading Signal Statistics and Manipulated Performance
Trading signal services often use numbers to build credibility.
You may see claims such as:
- 92% win rate
- 3.8 Profit Factor
- +47% monthly return
- 18 winning trades in a row
- 95% signal accuracy
Numbers look objective.
That is exactly why they are persuasive.
But a statistic can be mathematically correct and still create a misleading impression if the underlying data is:
- Incomplete
- Selectively chosen
- Too small
- Limited to favorable periods
- Missing losing trades
- Missing Drawdown
- Presented without context
This is the key problem with fake trading signal statistics.
“Fake” does not always mean that someone simply invented a number.
Sometimes the numbers are real.
The manipulation happens through:
Selection + Omission + Presentation
For example, a provider may publish real winning trades while excluding losing trades.
The individual data points may be genuine.
The overall statistic is still unreliable.
That is why traders should not ask only:
“Is this number real?”
They should ask:
“How was this number calculated?”
That question is far more important.
Why Fake Trading Signal Statistics Matter
Signal statistics often influence real financial decisions.
A trader may:
- Subscribe to a service
- Increase position size
- Deposit more money
- Follow more signals
- Trust a provider with less scrutiny
because a performance statistic looks impressive.
If that statistic does not represent the complete trading history, the trader may underestimate risk.
Investor.gov specifically warns that performance claims can be presented in different ways and that investors should understand how a performance number was calculated and what information was included or excluded.
Investor.gov – Performance Claims
Fake Does Not Always Mean Fabricated
This distinction is essential.
There are several levels of unreliable statistics.
Completely Fabricated Statistics
Example:
A provider simply claims:
95% win rate
without any supporting trade history.
Manipulated Statistics
The underlying trades may exist, but the calculation is distorted.
Example:
Only winning trades are included.
Selective Statistics
The calculation may be accurate for one period, but that period was specifically chosen because it performed well.
Example:
+28% in March
while January, February, April and May were negative.
Incomplete Statistics
The numbers are correct but important information is missing.
Example:
Win Rate: 85%
but no data on:
- Average loss
- Drawdown
- Risk
- Sample size
All four cases can mislead traders.
Real Statistics vs. Selectable Data
One of the best ways to understand fake trading signal statistics is to distinguish complete data from selectable data.
Complete Data
Includes:
- Every trade
- Every winner
- Every loser
- Complete chronology
- Full period
- No hidden deletions
This allows meaningful evaluation.
Selectable Data
Allows the provider to choose:
- Best trades
- Best months
- Best instruments
- Best timeframes
- Best strategy period
The numbers may be accurate for the selected sample.
But the sample itself may be biased.
Red Flag 1: No Complete Trade History
A professional performance record should allow you to see the full sequence of trades.
For example:
Trade 1 → Win
Trade 2 → Loss
Trade 3 → Loss
Trade 4 → Win
Trade 5 → Win
Instead, many services show:
Trade 1 → Win
Trade 4 → Win
Trade 5 → Win
Now the chronology is broken.
This makes it difficult to evaluate:
- Losing streaks
- Drawdowns
- Strategy deterioration
- Real win rate
If there is no complete history, treat headline statistics cautiously.
Red Flag 2: Losing Trades Are Missing
This is one of the simplest ways to distort performance.
Suppose the actual record is:
20 total trades
15 winners
5 losers
The real win rate is:
75%
But if the 5 losing trades disappear and only 15 winners are displayed, users may wrongly assume:
15 wins from 15 trades = 100%
This is not a mathematical error.
It is a dataset error.
And dataset errors can be more dangerous because the remaining trades are technically real.
Red Flag 3: Win Rate Without Total Number of Trades
Whenever you see:
90% win rate
your next question should be:
90% of how many trades?
There is a huge difference between:
9 wins from 10 trades
and:
900 wins from 1,000 trades.
Sample size matters.
A very small sample can produce an extraordinary result simply by chance.
Why Sample Size Matters
Suppose a strategy wins:
8 of its first 10 trades.
Win rate:
80%
That sounds excellent.
But ten trades are not enough to understand how the system behaves across:
- Different volatility regimes
- Trending markets
- Range markets
- News periods
The larger and more diverse the sample, the more informative it becomes.
Red Flag 4: Extremely High Win Rate With No Risk Data
A very high win rate can be legitimate.
But it should not be evaluated alone.
For example:
Strategy A
Win Rate: 90%
Average Win: +$100
Average Loss: -$1,500
Over 10 trades:
9 × $100 = +$900
1 × $1,500 = -$1,500
Net result:
-$600
A 90% win rate can still lose money.
This is why Win Rate must be evaluated with:
- Average Win
- Average Loss
- Risk-to-Reward
- Expectancy
Red Flag 5: Profit Factor Without Raw Data
Profit Factor is often used because it sounds professional.
Formula:
Gross Profit ÷ Gross Loss
Example:
Gross Profit = $10,000
Gross Loss = $5,000
Profit Factor:
2.0
That can be useful.
But only if every trade is included.
How Profit Factor Can Be Manipulated
Suppose actual losses were:
$8,000
but $3,000 of losing trades were excluded.
Now the report shows:
Gross Profit = $10,000
Gross Loss = $5,000
PF = 2.0
Actual:
Gross Profit = $10,000
Gross Loss = $8,000
PF = 1.25
The input data changes everything.
Red Flag 6: Missing Maximum Drawdown
One of the biggest weaknesses in promotional signal statistics is the absence of Drawdown.
Suppose two services show:
+40% return
Provider A:
Maximum Drawdown: 8%
Provider B:
Maximum Drawdown: 55%
The same return does not mean the same quality.
Drawdown shows how painful the path was.
Why Drawdown Is Critical
It can reveal:
- Excessive leverage
- Large losing streaks
- Martingale
- Grid risk
- Poor Stop Loss discipline
A service that reports returns but never reports Drawdown is providing only half of the picture.
Red Flag 7: Only Short-Term Results Are Shown
A provider may advertise:
+35% this month
But one month tells you very little.
Short periods are highly affected by:
- Luck
- Volatility
- Market regime
- One large trade
Longer periods usually reveal:
- Drawdowns
- Weak months
- Performance variation
Short Windows Can Exaggerate Performance
Imagine:
January: -8%
February: -5%
March: +35%
April: -10%
May: -6%
Advertising only March creates a dramatically different impression from the complete five-month result.
Investor.gov explicitly describes this practice as cherry-picking when only periods of strong returns are highlighted while weaker periods are excluded.
Red Flag 8: Best Market Conditions Are Selected
A strategy may work very well in one market regime.
For example:
Breakout strategy → strong trend
The provider then publishes performance only from trending periods.
But the same strategy may perform poorly during:
- Range markets
- Low volatility
- Choppy price action
This creates sample-selection bias.
Red Flag 9: Selected Profit Screenshots Replace Statistics
Screenshots are visual evidence of a trade.
They are not a full performance dataset.
FastPip’s related analysis explains why individual profit screenshots cannot reveal:
- Sample size
- Risk
- Drawdown
- Losing trades
- Long-term consistency
FastPip – Trading Signal Profit Screenshots
A provider showing 50 profitable screenshots may still be hiding 100 losing trades.
You cannot know without complete data.
Red Flag 10: Statistics From Different Periods Are Mixed Together
This is another subtle problem.
A provider may show:
Win Rate: 88%
Return: +62%
Profit Factor: 3.2
But perhaps:
Win Rate = Last month
Return = Last 12 months
Profit Factor = One specific strategy
The three numbers look like one coherent report.
They are not.
All Metrics Should Come From the Same Dataset
Before trusting several statistics together, verify:
- Same time period
- Same account
- Same strategy
- Same trade sample
Otherwise the combination can create false confidence.
Red Flag 11: Average Performance Is Not Clearly Defined
“Average monthly return” can be calculated in several ways.
Suppose a service had:
Month 1: +30%
Month 2: -20%
Month 3: +25%
A provider may choose a calculation method that makes the average look more attractive.
The important question is:
What exact data went into the calculation?
Red Flag 12: No Raw Data
This is one of the strongest warning signs.
A performance summary says:
Win Rate: 87%
Profit Factor: 4.1
Return: +70%
But users cannot inspect:
- Trade list
- Entries
- Exits
- Stop Losses
- Position sizes
- Timestamps
Then the statistics are difficult to verify independently.
Why Raw Data Matters
Raw data allows you to calculate the statistics yourself.
If Provider A says:
Win Rate: 82%
you should ideally be able to count:
Winners ÷ Total Trades
and get approximately the same answer.
That is verification.
Without raw data, you only have a claim.
Red Flag 13: Total Number of Trades Is Hidden
This should always trigger questions.
Imagine a provider says:
92% accuracy
but refuses to say how many trades were used.
Possible sample:
12 trades
or:
1,200 trades.
These are not equivalent.
Red Flag 14: Risk per Trade Is Missing
Return cannot be understood without risk.
Suppose Provider A earns:
+20%
while risking:
0.5% per trade
Provider B earns:
+20%
while risking:
10% per trade
The headline return is the same.
The underlying quality is radically different.
Red Flag 15: Strategy Is Completely Undefined
A provider does not necessarily need to reveal proprietary code or every trading rule.
But there should be enough information to understand:
- What markets are traded
- Typical holding time
- Risk style
- General methodology
Without any strategy context, statistics become hard to interpret.
Why Strategy Context Matters
A scalping strategy producing:
500 trades
should not be compared directly with a swing strategy producing:
20 trades
without considering frequency and holding period.
FastPip’s Trading Types guide explains how different trading styles vary in timeframe, execution requirements and trade frequency.
Red Flag 16: Social Proof Is Used Instead of Evidence
Some services rely heavily on:
- Testimonials
- Subscriber counts
- Telegram comments
- User profit screenshots
- Influencer endorsements
These may create trust.
They do not prove performance.
A channel with:
200,000 subscribers
can still have weak signals.
Popularity and statistical validity are unrelated.
Red Flag 17: Past Results Keep Changing
This is especially serious.
Suppose you monitor a service and notice:
- Old losing trades disappear
- Historical summaries change
- Previous months are edited
- Past trades get relabeled
This means the historical dataset is not stable.
Why Immutable History Matters
Professional records should be:
- Timestamped
- Preserved
- Auditable
If historical data can be rewritten after the outcome is known, statistics lose credibility.
Red Flag 18: Cherry-Picking Winning Periods
Cherry-picking is one of the most common forms of misleading performance reporting.
The SEC’s Investor.gov defines cherry-picked performance as presenting only periods with strong returns or only profitable investments while excluding weaker outcomes.
This is directly relevant to trading signal marketing.
Red Flag 19: No Consecutive-Loss Data
A system might show:
70% win rate
but still experience:
8 consecutive losses.
That matters.
Losing streaks affect:
- Drawdown
- Psychology
- Position sizing
- Account survival
Yet many signal reports exclude this information.
Red Flag 20: Unrealistically Smooth Equity Curves
Real trading performance usually fluctuates.
An equity curve that rises in an almost perfect straight line should be examined carefully.
It may be genuine.
But traders should investigate:
- How losses are recorded
- Whether floating losses are included
- Whether closed balance is shown instead of equity
- Whether periods were omitted
Balance vs. Equity Can Hide Risk
Imagine an account has:
Balance: $10,000
Open floating loss: -$3,000
Balance-based reporting still shows:
$10,000
Equity is:
$7,000
If statistics are based only on closed trades, floating risk may disappear.
This is especially important in:
- Grid systems
- Martingale
- Averaging strategies
Fake Trading Signal Statistics and Survivorship Bias
Another related problem is Survivorship Bias.
Users may see:
- Successful providers
- Winning strategies
- Active channels
while failed services disappear.
FastPip has covered this separately.
FastPip – Survivorship Bias in Trading Signals
This matters because statistics drawn only from surviving strategies can overstate expected success.
Fake Statistics and Profit-Only Channels
Another closely related pattern appears when channels publish only winners.
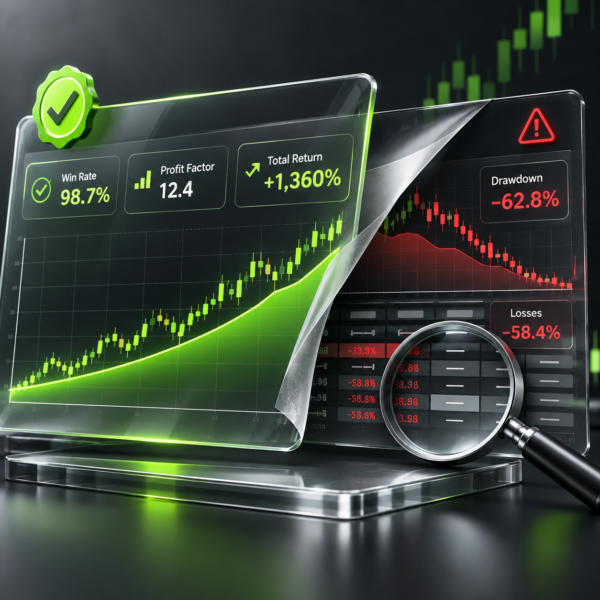
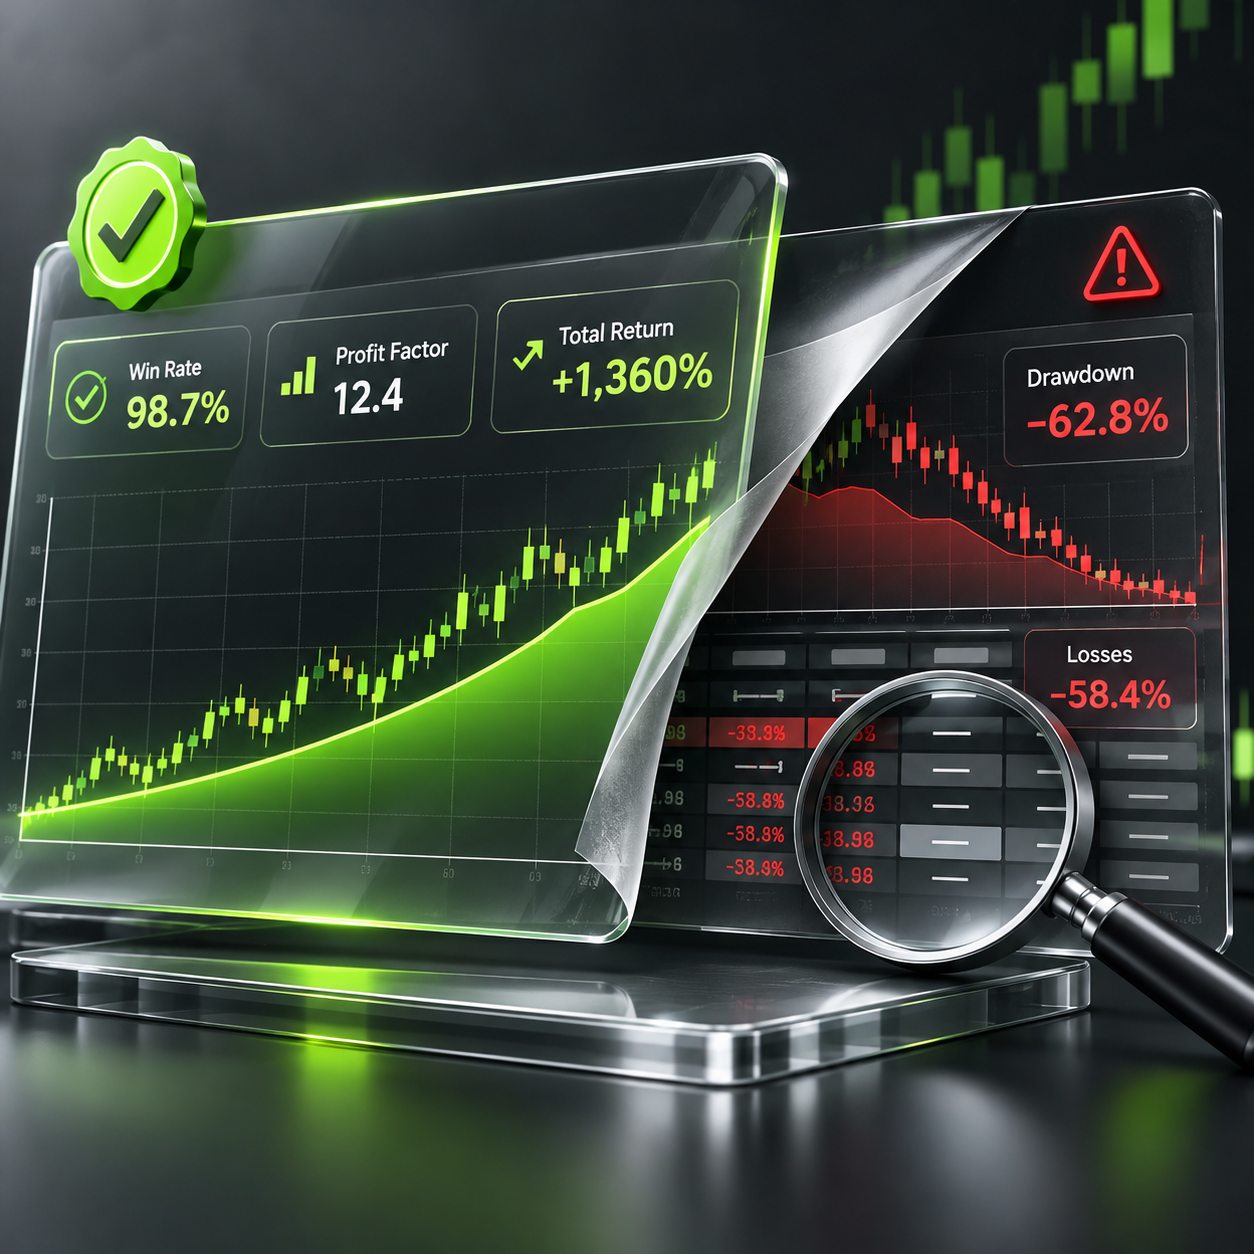
If losses disappear, almost every performance metric can improve artificially.
Examples:
Win Rate → increases
Profit Factor → increases
Average Return → increases
Drawdown → decreases
This is why complete data matters more than attractive numbers.
A Simple Example of Statistical Manipulation
Suppose actual results are:
| Trade | Result |
|---|---|
| 1 | +2R |
| 2 | -1R |
| 3 | +1R |
| 4 | -1R |
| 5 | -1R |
| 6 | +3R |
| 7 | -1R |
| 8 | +1R |
Actual:
Winners = 4
Losers = 4
Win Rate = 50%
Now imagine only winning trades are shown.
Visible record:
+2R
+1R
+3R
+1R
Visible win rate:
100%
No trade was fabricated.
The dataset was manipulated.
How to Verify Win Rate Yourself
Use:
Winning Trades ÷ Total Trades × 100
Example:
64 winners
36 losers
Total:
100
Win Rate:
64%
If the provider says:
85%
you have a problem.
How to Verify Profit Factor
Formula:
Total Gross Profit ÷ Total Gross Loss
Example:
Gross Profit = $12,000
Gross Loss = $6,000
Profit Factor:
2.0
If you cannot identify all profitable and losing trades, you cannot verify Profit Factor.
How to Evaluate Drawdown
Ask for:
- Maximum Drawdown
- Relative Drawdown
- Equity Drawdown
- Drawdown duration
Do not rely only on final return.
Check Whether Floating Losses Are Included
This is especially important.
A provider may show:
Closed Profit: +$5,000
while current open positions have:
Floating Loss: -$8,000
Closed results look profitable.
Equity does not.
Always distinguish:
Balance vs. Equity
Check the Time Period
Every statistic should identify:
- Start date
- End date
Without this, a provider can easily mix periods.
Example:
+25% return
Over:
One week?
One month?
Three years?
The number has completely different meaning.
Check Whether All Symbols Are Included
A provider may show only its best market.
For example:
Gold: +30%
but omit:
EURUSD: -10%
GBPUSD: -12%
NASDAQ: -15%
Then “performance” becomes another form of selection.
Check Whether Failed Strategies Disappeared
A service may test multiple strategies.
Only the successful strategy remains public.
The failed models disappear.
This can create survivorship bias inside the same provider.
Check Whether Old Posts Have Been Edited
Telegram and similar platforms can make historical verification difficult if messages are:
- Deleted
- Edited
- Reposted
Maintain screenshots or your own journal if you are testing a service.
Use Your Own Trading Journal
One of the strongest defenses against fake trading signal statistics is independent recordkeeping.
Record every signal.
Include:
- Date
- Time
- Symbol
- Direction
- Entry
- Stop Loss
- Take Profit
- Result
- Provider result
- Your result
Over time, you build your own dataset.
Why Your Dataset Is More Valuable Than Marketing Reports
Your own history includes:
- Signals the provider may stop discussing
- Losing trades
- Execution differences
- Slippage
- Missed signals
This produces a much more realistic picture.
15-Point Checklist for Detecting Fake Trading Signal Statistics
Use this before trusting any performance claim.
1. Is the Total Number of Trades Disclosed?
If not, Win Rate means little.
2. Are Losing Trades Included?
Incomplete data distorts every metric.
3. Is the Trade History Chronological?
Look for continuity.
4. Is Maximum Drawdown Reported?
Return alone is not enough.
5. Is Risk per Trade Clear?
Understand how aggressively the system trades.
6. Can You See Raw Trade Data?
Screenshots are not enough.
7. Are Metrics Calculated From the Same Period?
Avoid mixed datasets.
8. Is Sample Size Large Enough?
Small samples are vulnerable to luck.
9. Is Profit Factor Verifiable?
Check gross profits and losses.
10. Are Floating Losses Included?
Balance can hide equity risk.
11. Are Different Market Conditions Included?
Avoid best-regime-only results.
12. Are Old Results Stable?
Historical data should not keep changing.
13. Are Strategy Rules Consistent?
Watch for strategy drift.
14. Is Performance Independently Verifiable?
Independent evidence is stronger.
15. Are Claims Realistic?
Extreme statistics require stronger evidence.
What a Trustworthy Performance Report Should Look Like
A professional signal report should ideally show:
| Metric | Example |
|---|---|
| Total Trades | 250 |
| Winners | 150 |
| Losers | 100 |
| Win Rate | 60% |
| Average Win | +1.8R |
| Average Loss | -1R |
| Profit Factor | 1.65 |
| Max Drawdown | 12% |
| Net Return | +28% |
| Period | 12 Months |
This does not guarantee future performance.
But it provides a much better basis for analysis.
Why Independent Verification Matters
Self-reported statistics always carry some conflict of interest.
A provider benefits from strong results.
Independent verification reduces the ability to:
- Delete losses
- Rewrite history
- Choose only favorable periods
The more important the financial decision, the more valuable independent evidence becomes.
Not Every Incomplete Report Is Fraudulent
This article should remain balanced.
A provider may have incomplete statistics because:
- It is a small service
- It lacks reporting infrastructure
- It focuses on education
- It has a short track record
Incomplete reporting does not automatically prove fraud.
But it does reduce confidence.
The appropriate conclusion is:
Less evidence = More uncertainty
not:
Less evidence = Automatically fake
Conclusion: How to Detect Fake Trading Signal Statistics
Detecting fake trading signal statistics is not about finding one magical warning sign.
It is about examining the entire data structure.
The strongest red flags include:
- Missing losing trades
- No total trade count
- Extremely high Win Rate without context
- No Maximum Drawdown
- Profit Factor without raw data
- Very short reporting periods
- Selected favorable market regimes
- Changing historical results
- No independent verification
- Metrics calculated from different datasets
The most important principle is:
Do not judge the statistic. Judge the dataset behind the statistic.
Investor.gov’s guidance on performance claims makes the same fundamental point: investors should understand exactly how performance is calculated and presented, and cherry-picked strong periods can create misleading impressions.
A number such as:
92% Win Rate
may look impressive.
But before trusting it, ask:
92% of how many trades?
Where are the losses?
What was the Drawdown?
What was the risk?
Can I reconstruct the number from raw data?
If you cannot answer those questions, the statistic has limited analytical value.
In trading, attractive numbers are easy to display.
Transparent data is much harder to fake.
Frequently Asked Questions
What are fake trading signal statistics?
Fake trading signal statistics are fabricated, manipulated, incomplete or selectively presented performance numbers that create an inaccurate impression of signal quality.
Can trading statistics be misleading even if the numbers are real?
Yes. Real numbers can still mislead if losing trades, weak periods or important risk data are excluded.
How can I verify a signal provider’s Win Rate?
Divide the number of winning trades by the total number of trades and multiply by 100.
Is a 90% Win Rate always good?
No. You also need average win, average loss, Drawdown, risk and sample size.
Why does sample size matter?
Small samples are much more vulnerable to random short-term success.
What is Profit Factor?
Profit Factor is total gross profit divided by total gross loss.
Can Profit Factor be manipulated?
Yes. If losing trades are removed or omitted, Profit Factor can appear artificially high.
Why is Drawdown important?
Drawdown reveals how much the strategy declined from a previous peak and provides critical information about risk.
What does missing raw data mean?
It means you cannot independently reconstruct the provider’s reported performance statistics.
Are profit screenshots enough to verify statistics?
No. Screenshots usually show selected individual trades rather than a complete dataset.
What is cherry-picking?
Cherry-picking is selecting favorable trades or strong periods while excluding poor results.
Why should performance have a clear time period?
Without a start and end date, statistics can be taken from selectively favorable periods.
Can balance reporting hide risk?
Yes. Open floating losses may reduce equity even when the closed account balance looks strong.
Does incomplete reporting automatically mean a scam?
No. It means there is insufficient evidence to verify the performance properly.
What is the best way to detect manipulated signal statistics?
Look for complete chronological trade history, total trade count, winners and losers, Drawdown, risk metrics, raw data and independently verifiable records.