
GBP/USD Intraday Forecast: Bearish Outlook Below 1.3244
Introduction
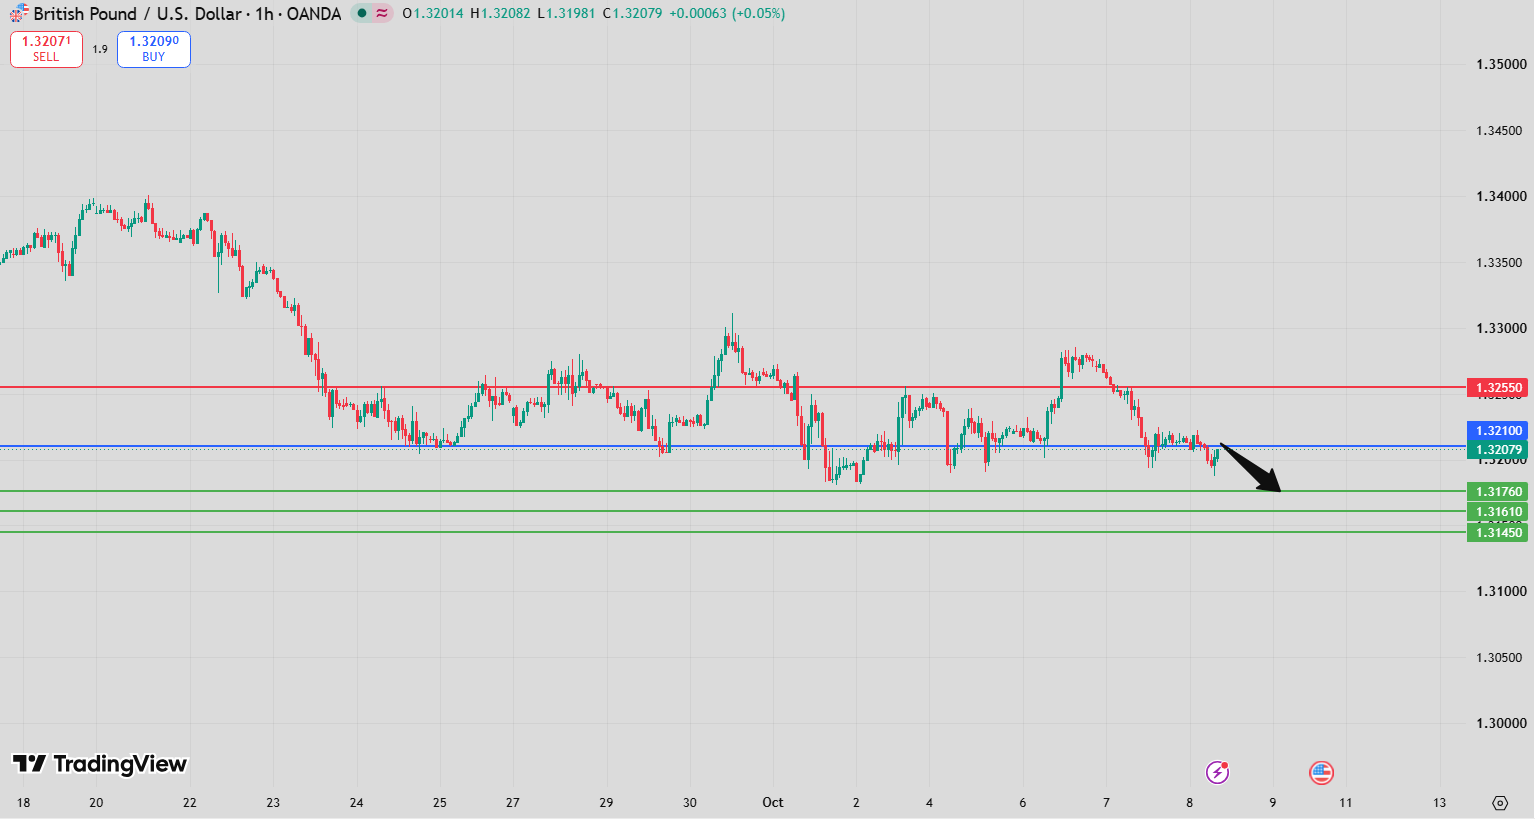
The GBP/USD Intraday Forecast remains bearish while 1.3244 continues to act as the key resistance level. The current technical structure favors further downside, with 1.3176 and 1.3161 identified as the primary targets for sellers.
The broader technical picture supports the bearish preference. The RSI remains below its neutrality area at 50, indicating that bearish momentum continues to dominate the short-term structure. At the same time, the MACD is below its signal line and remains negative, providing additional confirmation of downside momentum.
Price is also trading below both the 20-period moving average at 1.3210 and the 50-period moving average at 1.3215. This positioning keeps the short-term trend under pressure and strengthens the case for a continuation toward the downside targets.
The alternative scenario would become active if GBP/USD decisively breaks above 1.3244. In that case, the pair could recover toward 1.3269 and potentially 1.3284.
GBP/USD Intraday Forecast Technical Analysis
From a technical perspective, 1.3244 remains the central pivot and resistance level controlling the current setup. As long as GBP/USD remains below this threshold, sellers retain the technical advantage and the downside scenario remains preferred.
The first major downside target is 1.3176. This level represents the primary objective for the current bearish setup. If selling pressure remains active, the pair could gradually move toward this target as traders continue to favor the downside below resistance.
A decisive break below 1.3176 would strengthen the bearish structure and expose 1.3161 as the next downside objective. The relatively close distance between the two targets means that a strong bearish move could allow the market to test both levels within the same intraday sequence.
The moving-average structure further supports the bearish outlook. GBP/USD is trading below its 20-period moving average at 1.3210 and its 50-period moving average at 1.3215. The fact that price remains below both averages indicates that sellers have maintained control of the immediate trend.
The RSI also remains below 50, confirming that momentum is positioned on the bearish side of the neutral threshold. This reduces the probability of a sustained bullish recovery unless buyers can first reclaim the nearby technical barriers.
The MACD is another important confirmation. With the indicator below its signal line and negative, downside momentum remains clearly established. Unlike a situation where the MACD is recovering above its signal line, the current configuration provides stronger confirmation for the bearish scenario.
As long as price remains below 1.3244, the technical path toward 1.3176 and 1.3161 remains favored.
GBP/USD Intraday Forecast Market Sentiment Analysis
Market sentiment remains bearish, supported by the alignment of several short-term technical indicators.
The RSI being below 50 indicates that bearish momentum remains stronger than bullish momentum. Although the indicator alone does not guarantee further downside, its position below the neutral threshold supports the current directional bias.
The MACD provides additional confirmation because it is below its signal line and negative. This combination suggests that downside momentum is currently established rather than merely the result of a temporary price fluctuation.
The moving averages also reinforce the bearish sentiment. GBP/USD is below both the 20-period average at 1.3210 and the 50-period average at 1.3215, creating a technical environment where rallies may face selling pressure.
For sentiment to shift meaningfully, buyers would need to reclaim these moving averages and ultimately break above 1.3244. Until that happens, the market remains tilted toward sellers.
A failure to overcome the resistance would keep attention focused on 1.3176, while a clean break of that level could accelerate the move toward 1.3161.
GBP/USD Intraday Forecast Support and Resistance Levels
Key Pivot Resistance: 1.3244
The 1.3244 level is the primary pivot and resistance for the current GBP/USD Intraday Forecast. The bearish outlook remains active while the pair stays below this threshold.
First Downside Target: 1.3176
The first major bearish objective is 1.3176. This is the main target that sellers are expected to challenge while 1.3244 remains resistance.
Second Downside Target: 1.3161
The second downside target is 1.3161. A decisive break below 1.3176 would increase the probability of reaching this level.
Alternative Upside Target: 1.3269
If GBP/USD breaks decisively above 1.3244, the alternative bullish scenario becomes active, with 1.3269 as the first upside objective.
Secondary Upside Target: 1.3284
A sustained move above 1.3269 could extend the recovery toward 1.3284.
Key Levels
- Pivot Resistance: 1.3244
- Target A: 1.3176
- Target B: 1.3161
- Alternative Target A: 1.3269
- Alternative Target B: 1.3284
- 20-Period MA: 1.3210
- 50-Period MA: 1.3215
- RSI: Below 50
- MACD: Below signal line and negative
GBP/USD Intraday Forecast Trading Scenario Analysis
Bearish Scenario
The primary scenario remains bearish while 1.3244 acts as resistance. If sellers maintain control below this pivot, GBP/USD could continue toward 1.3176.
A clean break below 1.3176 would strengthen bearish momentum and expose 1.3161 as the next target.
The current RSI, MACD and moving-average configuration supports this scenario. RSI remains below 50, MACD is below its signal line and negative, and price remains below both key moving averages.
Pullback Scenario
A temporary recovery cannot be ruled out, particularly if traders take profits from existing short positions as the pair approaches the first target.
GBP/USD could attempt to recover toward the 1.3210–1.3215 moving-average zone. However, such a rebound would not automatically invalidate the bearish structure.
As long as the recovery remains below 1.3244, the broader intraday downside scenario remains intact. Failure to reclaim the pivot could attract sellers again and redirect the pair toward 1.3176.
Bullish Alternative Scenario
The alternative scenario becomes active if GBP/USD decisively breaks above 1.3244.
Such a move would weaken the current bearish structure and indicate that buyers have overcome the main resistance barrier. The first upside target would then be 1.3269, followed by 1.3284 if bullish momentum continues.
A sustained breakout above 1.3244 would therefore represent the main invalidation point for the current bearish preference.
GBP/USD Intraday Forecast Risk Factors and Alternative Outlook
The main risk to the bearish outlook is a sustained breakout above 1.3244. Because this level represents the key pivot, a successful reclaim could trigger short covering and attract additional buyers.
Another risk is a temporary recovery toward the moving averages. Since price is already below both the 20-period and 50-period averages, these levels may act as dynamic resistance. However, a strong recovery through both averages would weaken the bearish structure.
The RSI and MACD also need to be monitored for changes in momentum. A recovery in RSI above 50 or a bullish shift in the MACD could signal that selling pressure is weakening.
Nevertheless, the current alignment remains bearish: price is below both moving averages, RSI is below 50, and MACD is below its signal line while remaining negative.
Therefore, unless the pair reclaims 1.3244, the downside scenario remains technically favored.
GBP/USD Intraday Forecast Conclusion
The current GBP/USD Intraday Forecast remains bearish while 1.3244 acts as resistance, with 1.3176 and 1.3161 as the primary downside targets.
The technical structure is supported by several bearish signals. RSI remains below the neutral level of 50, MACD is below its signal line and negative, and price is trading below both the 20-period moving average at 1.3210 and the 50-period moving average at 1.3215.
If selling pressure continues, the pair could move toward 1.3176. A decisive break below this level would strengthen the downside structure and open the path toward 1.3161.
Conversely, a sustained breakout above 1.3244 would invalidate the preferred bearish scenario and shift attention toward 1.3269 and 1.3284.
For short-term traders, 1.3244 remains the decisive pivot, while 1.3176 is the first major downside target and 1.3161 the next level to monitor.
FAQ
What is the key level in the GBP/USD Intraday Forecast?
The key level is 1.3244, which currently acts as the main pivot and resistance. The bearish outlook remains valid while GBP/USD stays below this level.
What are the main downside targets for GBP/USD?
The primary downside targets are 1.3176 and 1.3161. A break below 1.3176 would increase the probability of reaching 1.3161.
What do the RSI and MACD indicate?
The RSI is below 50, showing bearish momentum relative to the neutral threshold. The MACD is below its signal line and negative, providing additional confirmation of the bearish structure.
How are the moving averages positioned?
GBP/USD is trading below both the 20-period moving average at 1.3210 and the 50-period moving average at 1.3215. This configuration supports the current bearish outlook.
What happens if GBP/USD breaks above 1.3244?
A sustained break above 1.3244 would activate the alternative bullish scenario, with 1.3269 as the first target and 1.3284 as the second.

