
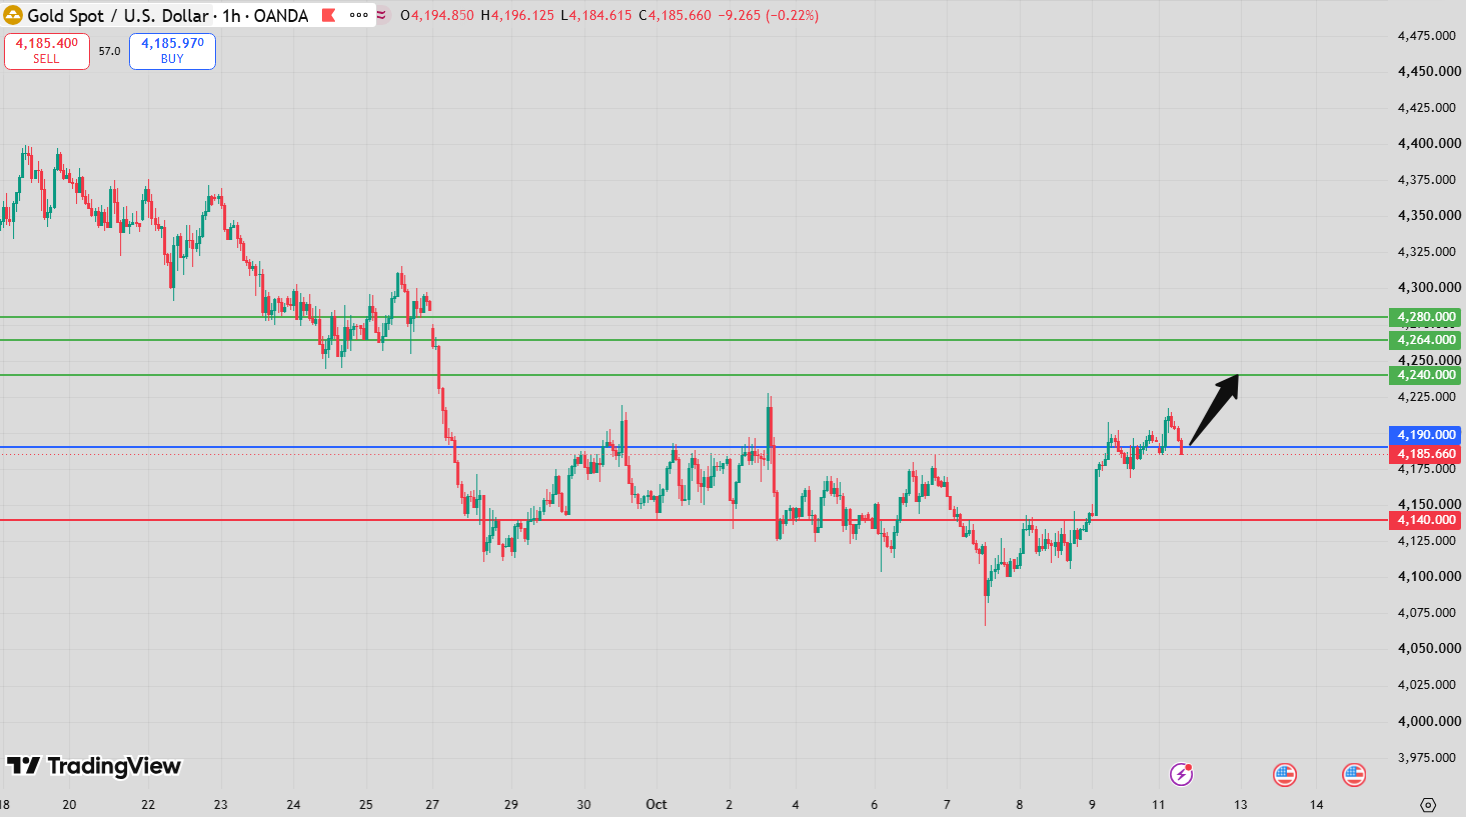
Gold Intraday Forecast: Upside Toward 4,240 and 4,264 While 4,151 Holds
Introduction
The Gold Intraday Forecast favors further upside as long as the key support level at 4,151 remains intact. The primary technical objectives are 4,240 and 4,264, provided buyers maintain control and the market can overcome nearby resistance.
The current technical picture is mixed rather than uniformly bullish. Gold is trading below its 20-period moving average at 4,200, which suggests that short-term price pressure remains present. However, the price is still above its 50-period moving average at 4,192, indicating that the broader short-term support structure has not been completely lost.
The MACD is below its signal line but remains in positive territory. This configuration suggests that bullish momentum may be slowing, even though the indicator has not moved into negative territory. Consequently, the 4,151 pivot is especially important for determining whether gold can resume its upward movement or whether the current setup will weaken.
As long as this support holds, the preferred scenario remains bullish toward 4,240 and 4,264. A decisive break below the pivot, however, would shift attention toward 4,112 and 4,088.
Gold Intraday Forecast Technical Analysis
The Gold Intraday Forecast maintains a bullish bias while 4,151 acts as support. Nevertheless, the moving averages and MACD indicate that traders should seek confirmation rather than assume that upward momentum is already accelerating.
The primary technical path is:
Above 4,151 → 4,240 → 4,264
Gold is currently below its 20-period moving average at 4,200. This suggests that the market has not yet fully recovered its immediate short-term momentum. The 20-period average may therefore act as an intermediate resistance area during a potential rebound.
At the same time, gold remains above its 50-period moving average at 4,192. This provides some support to the broader short-term structure and helps explain why the bullish scenario remains valid while the key pivot is intact.
The MACD being below its signal line indicates that upward momentum has weakened relative to the previous phase. However, because the MACD remains positive, the signal does not independently confirm a fully bearish trend.
The next important technical test is whether gold can regain the 4,200 area and sustain a move above the short-term moving average. If buyers succeed while 4,151 remains intact, the market could continue toward 4,240, followed by 4,264.
Gold Intraday Forecast Market Sentiment Analysis
The Gold Intraday Forecast reflects a cautiously bullish outlook. The main technical condition supports buyers while gold remains above 4,151, but the momentum indicators suggest that the market may need additional buying pressure before a sustained advance develops.
The MACD below its signal line signals that bullish momentum is not currently strengthening. Meanwhile, the price remaining below the 20-period moving average shows that short-term resistance is still relevant.
However, gold’s position above the 50-period moving average suggests that the broader intraday structure may still support a recovery. Traders should therefore distinguish between a temporary loss of momentum and a confirmed trend reversal.
Broader market developments can also affect gold prices, including:
- US dollar movements
- Treasury yields and real interest rates
- Federal Reserve policy expectations
- Inflation and employment data
- Geopolitical tensions and safe-haven demand
- Investor positioning in precious metals
- Changes in global risk sentiment
These factors may influence whether buyers can push gold toward its upside targets. For this particular setup, the 4,151 pivot and the market’s reaction around the moving averages remain the primary technical reference points.
Gold Intraday Forecast Support and Resistance Levels
The main levels in the current Gold Intraday Forecast define the preferred bullish scenario and the alternative bearish path.
Key Pivot Support: 4,151
The key support level is 4,151. As long as gold remains above this area, the bullish scenario remains preferred.
A sustained break below the pivot would weaken the current setup and shift attention toward lower support levels.
First Upside Target: 4,240
The first upside objective is 4,240. Gold would need to regain short-term momentum and overcome intermediate resistance before reaching this level.
A reaction near 4,240 could lead to profit-taking or temporary consolidation.
Second Upside Target: 4,264
If buyers maintain control and gold extends its move above 4,240, the next target becomes 4,264.
A sustained advance toward this level would support the bullish continuation scenario.
Alternative Downside Target: 4,112
A decisive break below 4,151 would weaken the bullish outlook and expose 4,112 as the first alternative downside objective.
Second Alternative Downside Target: 4,088
If selling pressure continues below 4,112, gold could extend its decline toward 4,088.
Key Levels Summary
- Pivot / Support: 4,151
- Target A: 4,240
- Target B: 4,264
- Alternative Target A: 4,112
- Alternative Target B: 4,088
- 20-period moving average: 4,200
- 50-period moving average: 4,192
Gold Intraday Forecast Trading Scenario Analysis
The preferred Gold Intraday Forecast remains bullish while 4,151 continues to hold. However, the mixed momentum signals make it important to monitor price behavior around the moving averages and the key pivot.
Bullish Continuation Scenario
If gold holds above 4,151 and buying pressure improves, the market could recover toward 4,200, where the 20-period moving average may act as an intermediate technical barrier.
A sustained move above this area could strengthen the recovery and open the way toward 4,240. If buyers then overcome the first target, the next objective would be 4,264.
The preferred bullish path is:
4,151 support → 4,200 → 4,240 → 4,264
The recovery would be more convincing if price action strengthens while the MACD begins to improve relative to its signal line.
Consolidation and Pullback Scenario
Gold may consolidate around the moving averages before making its next directional move. Because the MACD is below its signal line and price remains below the 20-period average, a direct move toward 4,240 is not guaranteed.
A temporary pullback would not automatically invalidate the bullish scenario if the market continues to hold above 4,151. The key consideration is whether buyers can defend the pivot and prevent the pullback from developing into a deeper decline.
Bearish Alternative Scenario
The bullish outlook would weaken if gold breaks decisively below 4,151 and sustains trading beneath the pivot.
In that situation, sellers could push the price toward 4,112, followed by 4,088 if downward pressure continues.
The alternative bearish path is:
Below 4,151 → 4,112 → 4,088
A sustained move below the pivot would carry more significance than a brief intraday dip, particularly if the price also loses support around the 50-period moving average.
Gold Intraday Forecast Risk Factors and Alternative Outlook
The main risk to the bullish Gold Intraday Forecast is a sustained break below 4,151. Such a move would invalidate the preferred support-based scenario and increase the relevance of the downside targets at 4,112 and 4,088.
Another risk is the weakening momentum indicated by the MACD. Although the indicator remains positive, its position below the signal line suggests that buyers may need additional confirmation before a stronger advance develops.
Gold’s position below the 20-period moving average at 4,200 also creates a potential obstacle to the bullish scenario. If price repeatedly fails to reclaim this level, the recovery could remain limited or develop into a period of consolidation.
Unexpected movements in the US dollar, Treasury yields, economic releases, or geopolitical conditions could also cause volatility around the key technical levels.
Traders should therefore avoid relying on a single indicator. The most useful confirmation would come from the interaction between price action, the 4,151 pivot, the moving averages, and changes in MACD momentum.
Gold Intraday Forecast Conclusion
The Gold Intraday Forecast favors further upside while 4,151 remains support, with 4,240 and 4,264 as the primary targets.
The technical outlook is cautiously bullish rather than strongly confirmed. Gold remains above its 50-period moving average at 4,192 but below its 20-period moving average at 4,200. Meanwhile, the MACD is below its signal line but still positive, indicating that momentum has weakened without independently confirming a bearish reversal.
A recovery above 4,200 could strengthen the bullish scenario and help gold advance toward 4,240 and 4,264. Conversely, a decisive break below 4,151 would weaken the preferred outlook and expose 4,112 and 4,088.
Overall, 4,151 remains the decisive pivot for this intraday setup. Above it, the preferred path remains toward 4,240 and 4,264. Below it, the alternative bearish scenario becomes more relevant.
FAQ
What is the current Gold Intraday Forecast?
The Gold Intraday Forecast favors upside while gold remains above 4,151, with targets at 4,240 and 4,264.
Why is 4,151 important for gold?
The 4,151 level is the key pivot support. Holding above it preserves the preferred bullish scenario, while a decisive break below it could expose lower targets.
What are the main upside targets for gold?
The first upside target is 4,240, followed by 4,264 if buying pressure continues.
What do the MACD and moving averages indicate?
The MACD is below its signal line but remains positive, suggesting that momentum has weakened. Gold is below its 20-period moving average at 4,200 but above its 50-period moving average at 4,192, producing a mixed short-term technical picture.
What happens if gold breaks below 4,151?
A sustained break below 4,151 would weaken the bullish outlook and could open the way toward 4,112 and 4,088.

