
Gold Intraday Forecast: Potential Turning Point Above 4,105 Support
Introduction
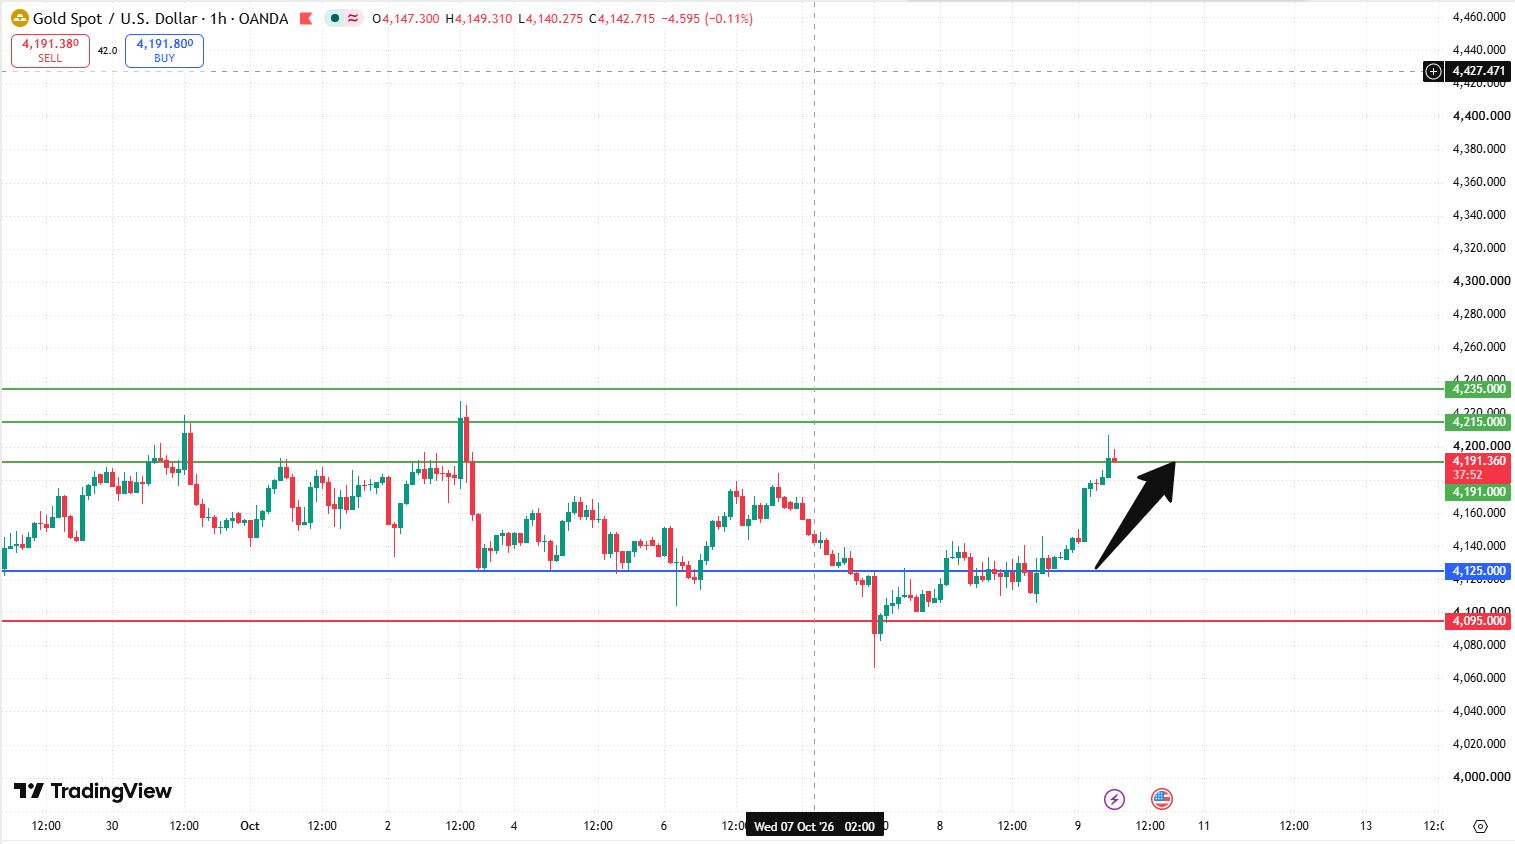
The Gold Intraday Forecast favors further upside as long as 4,105 continues to hold as support. The primary targets are 4,191 and 4,215, while the current chart structure suggests that gold is consolidating ahead of a potentially significant market move.
This consolidation phase is important because periods of tightening price action can precede a stronger directional breakout. However, consolidation alone does not confirm which direction the market will choose. Traders should monitor the reaction around the key support level and look for confirmation that buyers remain in control.
As long as gold holds above 4,105, the bullish scenario remains preferred. A sustained advance could bring the market toward 4,191, followed by 4,215 if buying pressure continues.
The alternative scenario becomes active if gold breaks below 4,105. In that case, selling pressure could increase and expose 4,066 as the first downside target, followed by 4,042.
Gold Intraday Forecast Technical Analysis
The current Gold Intraday Forecast is bullish while 4,105 remains the main support level. This price represents the key technical threshold separating the preferred upside scenario from the alternative bearish outlook.
The first upside objective is 4,191. If gold continues to hold above support and buyers generate sufficient momentum, the market could advance toward this level. A successful test of 4,191 would indicate that the current bullish structure is progressing toward its first major objective.
If buying pressure remains strong after the first target is reached, gold could extend its move toward 4,215. This second target represents the next upside objective and an important level to monitor for signs of continuation or profit-taking.
The chart’s consolidating structure adds another dimension to the setup. When price moves within a relatively narrow range, buyers and sellers may be competing to establish control. A decisive breakout can signal that one side has gained an advantage, but traders should avoid assuming that consolidation guarantees an immediate move in either direction.
A sustained move higher while 4,105 holds would support the bullish scenario. Conversely, a clear break below this support would weaken the outlook and shift attention toward 4,066 and 4,042.
For now, the preferred technical path remains above 4,105 toward 4,191 and 4,215. Confirmation from price action will be important, particularly if gold begins to expand beyond its current consolidation structure.
Gold Intraday Forecast Market Sentiment Analysis
The short-term sentiment reflected in this Gold Intraday Forecast is cautiously bullish. The main reason is that the preferred scenario remains valid while gold holds above 4,105, allowing buyers to maintain the possibility of a move toward the upside targets.
However, the current consolidation suggests that the market may be waiting for a stronger catalyst before committing to a sustained direction. In this environment, traders may see temporary advances and pullbacks as both sides respond to price movements around important technical levels.
A successful breakout toward 4,191 could reinforce bullish sentiment, especially if gold maintains its gains rather than quickly returning to the consolidation range. Continued strength beyond this target could then bring 4,215 into focus.
On the other hand, a failure to maintain support at 4,105 would weaken the bullish outlook. Sellers could gain control, potentially pushing gold toward 4,066 and then 4,042.
Broader factors may also influence gold sentiment, including US dollar movements, Treasury yields, Federal Reserve expectations, inflation data, geopolitical developments, and safe-haven demand. These factors can affect gold’s direction, but their impact should be assessed using current market information rather than assumed in advance.
For this setup, the most important signals remain the market’s reaction at 4,105 and its ability to break decisively toward the upside targets.
Gold Intraday Forecast Support and Resistance Levels
Key Pivot Support: 4,105
The 4,105 level is the primary support in the current Gold Intraday Forecast. As long as gold remains above this threshold, the bullish scenario stays preferred. A sustained break below it would weaken the upside structure and activate the alternative bearish outlook.
First Upside Target: 4,191
The first bullish objective is 4,191. A sustained move toward this level would support the view that buyers are maintaining control while the key support holds.
Second Upside Target: 4,215
The second upside objective is 4,215. If gold moves above 4,191 and bullish momentum remains strong, this level becomes the next target to monitor.
Alternative Downside Target: 4,066
If gold breaks below 4,105, the first bearish objective becomes 4,066. This level would be important for assessing whether the downside move is developing into a broader intraday decline.
Second Alternative Downside Target: 4,042
A sustained decline below 4,066 could expose 4,042 as the next downside objective.
Key Levels
- Pivot Support: 4,105
- Target A: 4,191
- Target B: 4,215
- Alternative Target A: 4,066
- Alternative Target B: 4,042
Gold Intraday Forecast Trading Scenario Analysis
Bullish Scenario
The primary scenario remains bullish while 4,105 continues to hold as support. If buyers defend this level and gold breaks out of its current consolidation structure, the market could advance toward 4,191.
A sustained move beyond the first target could extend the rally toward 4,215. Traders should monitor whether price maintains upward momentum after testing 4,191 or begins to show signs of rejection and profit-taking.
The key condition for this scenario is that gold remains above 4,105.
Consolidation and Breakout Scenario
Gold’s current chart structure suggests that price is coiling ahead of a potentially significant move. Consolidation can precede a breakout, but the direction is not confirmed until price establishes a decisive move beyond the relevant technical boundaries.
If gold holds above 4,105 and breaks higher, the bullish scenario toward 4,191 and 4,215 would gain support. A breakout that quickly reverses back into the consolidation range, however, could signal a false move and increase short-term volatility.
Traders should therefore look for sustained price action rather than treating a brief spike as confirmation of a new trend.
Bearish Alternative Scenario
The alternative scenario becomes active if gold decisively breaks below 4,105. Such a move would undermine the current bullish structure and suggest that sellers are gaining control.
In this case, the first downside target would be 4,066, followed by 4,042 if selling pressure continues.
A brief move below support that is quickly reversed would require a different interpretation from a sustained breakdown. The duration and strength of the move below 4,105 will therefore be important in assessing whether the bearish scenario is confirmed.
Gold Intraday Forecast Risk Factors and Alternative Outlook
The main risk to the bullish Gold Intraday Forecast is a decisive break below 4,105. If this support fails, the preferred upside scenario would weaken, and attention would shift toward 4,066 and 4,042.
Another risk comes from the current consolidation structure. While a tightening range can precede a strong move, it does not guarantee a bullish breakout. Gold could move sharply in either direction, particularly if market participants respond to new economic data or changes in expectations for US monetary policy.
A move toward 4,191 may also trigger profit-taking. If buyers struggle to sustain the advance beyond this first target, gold could temporarily pull back before establishing its next direction. Such a reaction would not automatically invalidate the bullish outlook as long as 4,105 remains intact.
Traders should also consider sudden changes in the US dollar, Treasury yields, inflation expectations, and safe-haven demand. These variables may increase volatility and cause price action to diverge from the expected technical path.
The clearest technical boundary remains 4,105. Holding above it favors the upside scenario, while a sustained breakdown would increase the risk of a decline toward the alternative targets.
Gold Intraday Forecast Conclusion
The current Gold Intraday Forecast favors further upside while 4,105 holds as support. The primary targets are 4,191 and 4,215, with the consolidating chart structure suggesting that a significant move may be approaching.
A sustained bullish breakout could take gold toward 4,191 and potentially extend the advance toward 4,215. However, traders should monitor the reaction at the first target for signs of continuation or temporary profit-taking.
If gold breaks decisively below 4,105, the bullish scenario would weaken and the alternative downside targets at 4,066 and 4,042 would become relevant.
Overall, 4,105 is the decisive support level for this intraday setup. Above it, the preferred path remains toward 4,191 and 4,215. Below it, the risk shifts toward 4,066 and 4,042.
FAQ
What is the current Gold Intraday Forecast?
The outlook favors further upside while gold remains above 4,105, with 4,191 as the first target and 4,215 as the second.
Why is 4,105 important?
The 4,105 level is the key support separating the preferred bullish scenario from the alternative bearish outlook. A sustained break below it could shift attention toward 4,066 and 4,042.
What are the main upside targets for gold?
The primary upside targets are 4,191 and 4,215. The market’s ability to maintain momentum toward and beyond 4,191 will be important for assessing the second target.
What does the consolidating chart structure mean?
Consolidation indicates that price is moving within a relatively narrow structure before a potential expansion. It may precede a significant move, but it does not establish the breakout direction on its own.
What happens if gold breaks below 4,105?
A decisive break below 4,105 would weaken the bullish outlook. The alternative downside targets would then be 4,066 and 4,042.

