
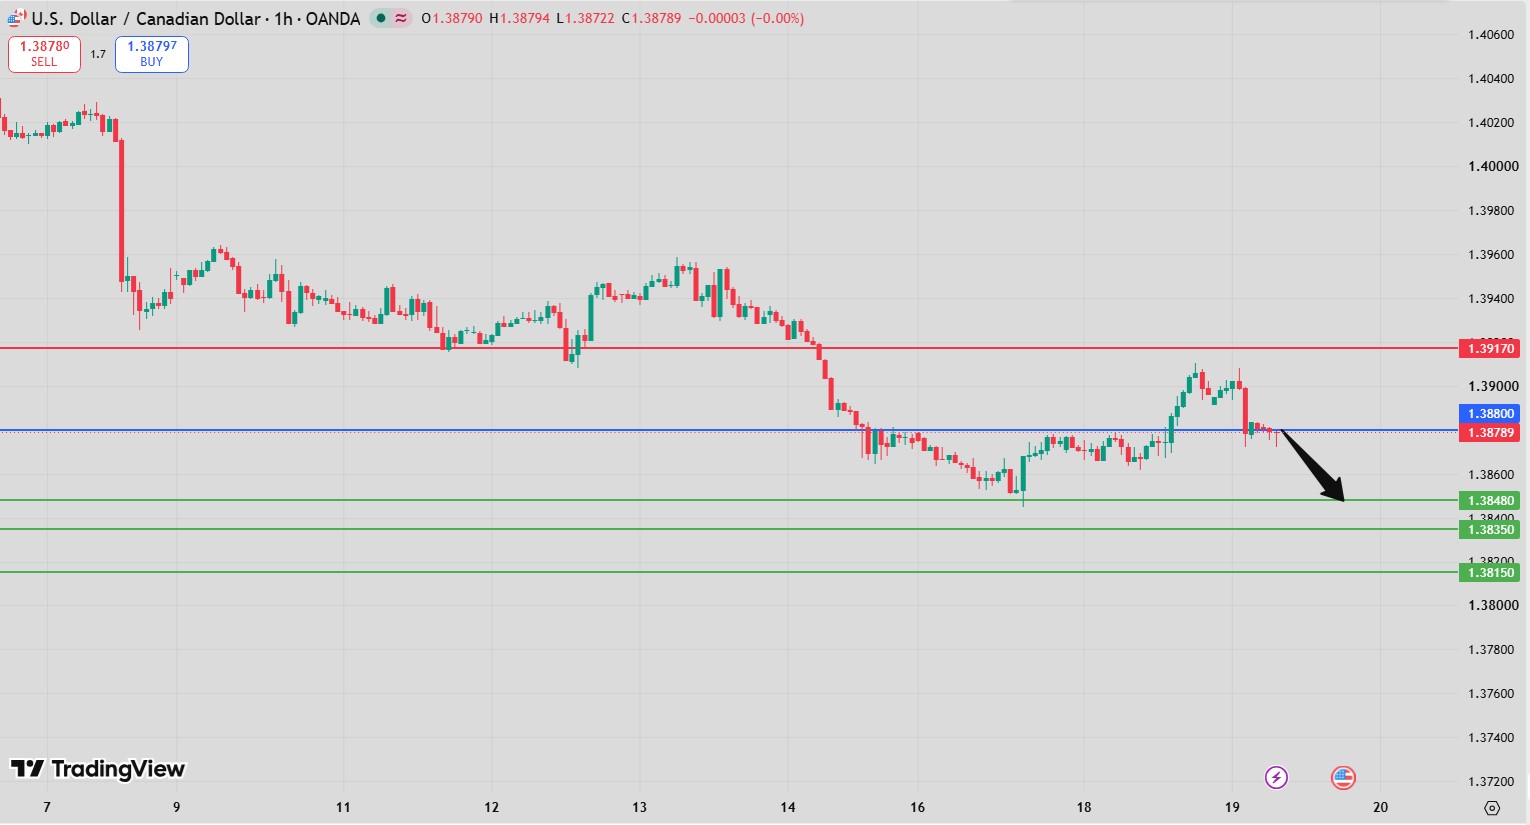
USD/CAD Intraday Forecast: Downside Toward 1.3848 and 1.3835 While 1.3917 Holds as Resistance
Introduction
The USD/CAD Intraday Forecast remains bearish as long as 1.3917 continues to act as resistance. The current technical structure favors further downside, with 1.3848 as the first target and 1.3835 as the second objective.
The technical indicators also support the bearish outlook. The RSI is below its neutrality area at 50, while the MACD remains below its signal line and negative. In addition, USD/CAD is trading below both its 20-period and 50-period moving averages, reinforcing the current downside structure.
The key level for the session is 1.3917. As long as the pair remains below this pivot, sellers retain control. A sustained break above 1.3917 would weaken the bearish setup and shift attention toward 1.3939 and 1.3951.
USD/CAD Intraday Forecast Technical Analysis
The USD/CAD Intraday Forecast favors the downside while 1.3917 remains resistance.
The preferred technical path is:
Below 1.3917 → 1.3848 → 1.3835
The first target at 1.3848 represents the primary downside objective. If sellers maintain control and the pair continues lower, the next target becomes 1.3835.
The indicator configuration is clearly tilted toward sellers. The RSI remains below 50, suggesting negative momentum, while the MACD is both below its signal line and in negative territory.
Moving-average positioning provides additional confirmation. The price is below the 20-period moving average around 1.3889 and also below the 50-period moving average near 1.3885. This indicates that the short-term price structure remains under pressure.
USD/CAD Intraday Forecast Market Sentiment Analysis
The USD/CAD Intraday Forecast currently reflects bearish market sentiment.
USD/CAD can be influenced by movements in the US dollar, Canadian economic data, interest-rate expectations and crude oil prices, given Canada’s significant exposure to the energy sector.
Important market drivers include:
- US dollar movements.
- Federal Reserve policy expectations.
- Bank of Canada expectations.
- Interest-rate differentials.
- Crude oil prices.
- Canadian economic data.
- US economic data.
- Global risk sentiment.
The current technical configuration favors sellers, particularly while the pair remains below 1.3917.
The combination of negative MACD momentum, an RSI below 50 and price trading below both moving averages suggests that buyers currently lack sufficient strength to reverse the short-term trend.
USD/CAD Intraday Forecast Support and Resistance Levels
The key levels in today’s USD/CAD Intraday Forecast are clearly defined.
Key Pivot Resistance: 1.3917
The main technical level is:
1.3917
As long as USD/CAD remains below this level, the bearish scenario remains preferred.
First Target: 1.3848
The primary downside objective is:
1.3848
A move toward this level would confirm continued selling pressure.
Second Target: 1.3835
If sellers maintain control below the first target, the next objective becomes:
1.3835
This represents the second downside target.
Alternative Upside Target: 1.3939
A sustained break above 1.3917 would activate the alternative scenario, with the first upside objective at:
1.3939
Second Alternative Target: 1.3951
Further bullish momentum could then expose:
1.3951
USD/CAD Intraday Forecast Trading Scenario Analysis
According to the USD/CAD Intraday Forecast, the preferred scenario remains bearish below 1.3917.
Bearish Scenario
The primary path is:
Below 1.3917 → 1.3848 → 1.3835
As long as 1.3917 continues to act as resistance, sellers retain control of the short-term structure.
A move toward 1.3848 would represent the first downside objective. Continued selling pressure below this level could then extend the decline toward 1.3835.
Consolidation Scenario
USD/CAD could temporarily consolidate below 1.3917 before making its next directional move.
Such consolidation would not invalidate the bearish setup as long as the pair remains below the key pivot.
The behavior around the moving averages could also provide clues about whether sellers are maintaining control or buyers are attempting to regain momentum.
Bullish Alternative Scenario
The alternative scenario becomes active above 1.3917.
A decisive breakout above this resistance could trigger a recovery toward 1.3939, followed by 1.3951.
This would signal that the current bearish structure is losing strength.
USD/CAD Intraday Forecast Risk Factors and Alternative Outlook
The main risk to the USD/CAD Intraday Forecast is a sustained break above 1.3917.
Although the technical indicators currently favor sellers, currency markets can reverse quickly following changes in monetary-policy expectations, economic data or commodity prices.
Important risk factors include:
- Sudden US dollar weakness.
- Changes in Federal Reserve expectations.
- Changes in Bank of Canada expectations.
- Sharp movements in crude oil prices.
- Unexpected Canadian economic data.
- Unexpected US economic data.
- Changes in global risk sentiment.
- A breakout above 1.3917.
The strongest warning signal for the bearish setup would be a decisive move above the key pivot.
Until that occurs, the downside remains the preferred direction.
USD/CAD Intraday Forecast Conclusion
The USD/CAD Intraday Forecast remains bearish below 1.3917, with 1.3848 as the first target and 1.3835 as the second downside objective.
The technical structure supports the bearish scenario. The RSI is below 50, the MACD is negative and below its signal line, while price is trading below both the 20-period and 50-period moving averages.
The key level remains 1.3917. As long as this resistance holds, the path toward 1.3848 and 1.3835 remains open.
Conversely, a sustained break above 1.3917 would weaken the bearish outlook and expose 1.3939 and 1.3951.
Overall, the current technical balance favors sellers.
FAQ
What is the current USD/CAD Intraday Forecast?
The USD/CAD Intraday Forecast remains bearish below 1.3917, with targets at 1.3848 and 1.3835.
Why is 1.3917 important?
It is the key pivot and resistance level. Holding below it keeps the bearish scenario active.
What are the downside targets?
The first target is 1.3848, followed by 1.3835.
What do the technical indicators show?
The RSI is below 50, the MACD is negative and below its signal line, while price is below both the 20-period and 50-period moving averages. These factors support the bearish bias.
What happens above 1.3917?
The alternative scenario points toward 1.3939 and 1.3951.

