
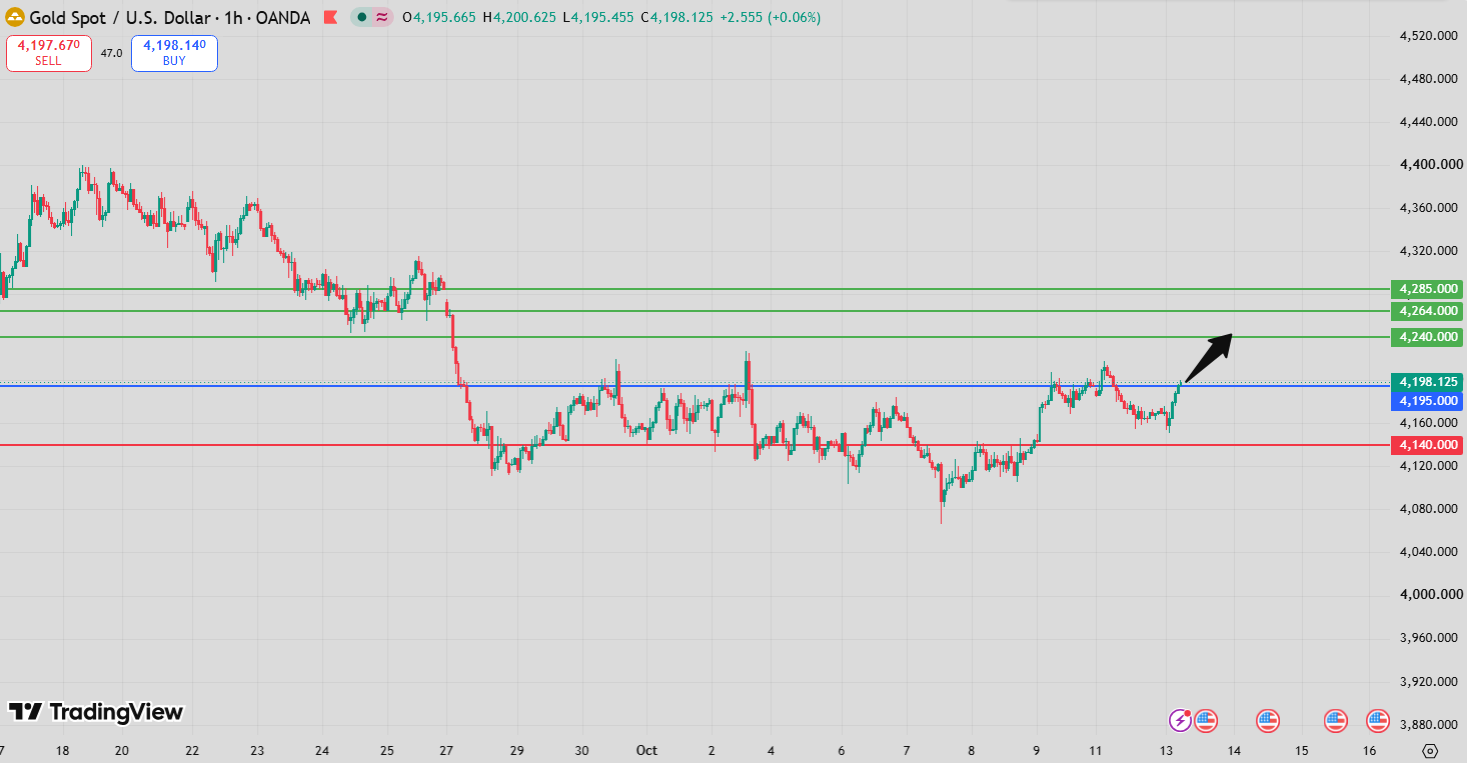
Gold Intraday Forecast: Upside Toward 4,240 and 4,264 While 4,151 Holds
Introduction
The Gold Intraday Forecast maintains a bullish outlook as long as the key support level at 4,151 remains intact. The primary upside targets are 4,240 and 4,264, with the latest technical indicators suggesting that buyers currently have the advantage.
The RSI is above its neutral level of 50, while the MACD is above its signal line and in positive territory. These readings support the current bullish momentum. Gold is also trading above its 20-period moving average at 4,172 and its 50-period moving average at 4,174, reinforcing the positive short-term structure.
Another important signal is that gold is trading above its upper Bollinger Band, currently positioned at 4,189. This indicates strong upward price pressure, although it also raises the possibility of a temporary pullback or consolidation after an extended move.
The 4,151 pivot remains the key level separating the preferred bullish scenario from the alternative bearish outlook. As long as support holds, the focus remains on 4,240 and 4,264. A decisive break below the pivot would shift attention toward 4,112 and 4,088.
Gold Intraday Forecast Technical Analysis
The Gold Intraday Forecast favors further upside while 4,151 acts as support. Unlike a setup with weakening momentum, the current signal shows the RSI above 50 and the MACD above its signal line in positive territory. Both indicators reinforce the bullish technical bias.
The primary technical path is:
Above 4,151 → 4,240 → 4,264
Gold is trading above its 20-period moving average at 4,172 and its 50-period moving average at 4,174. This positioning indicates that price remains above both short-term trend references. The moving averages may provide intermediate support during a pullback, although their levels can change as new candles form.
The Bollinger Band configuration adds another dimension to the analysis. Gold is trading above the upper band at 4,189, which suggests strong directional momentum. In a trending market, price can remain near or above the upper band for an extended period. However, this condition can also indicate that the market is stretched in the short term, increasing the possibility of consolidation or a temporary retracement.
The combination of positive RSI and MACD readings, price above both moving averages, and a move beyond the upper Bollinger Band supports the bullish scenario. Nevertheless, traders should distinguish between strong momentum and a guarantee of continued gains. A pullback toward the moving averages would not automatically invalidate the outlook if the key pivot at 4,151 remains intact.
Gold Intraday Forecast Market Sentiment Analysis
The Gold Intraday Forecast reflects positive short-term sentiment. The current technical configuration suggests that buyers are maintaining control, with the RSI and MACD both supporting the upward bias.
Trading above the upper Bollinger Band reinforces the strength of the recent advance, but it also makes the next price reaction important. Some traders may take profits after a rapid move, while others may wait for a pullback before entering the market. This can produce short-term volatility even when the broader intraday structure remains bullish.
Gold sentiment is also affected by wider macroeconomic developments, including:
- US dollar movements
- Treasury yields and real interest rates
- Federal Reserve policy expectations
- Inflation and employment data
- Geopolitical tensions and safe-haven demand
- Central-bank gold purchases
- Changes in investor positioning and risk appetite
A weaker dollar or declining real yields can support gold, while rising yields or stronger dollar demand may create headwinds. These relationships are not automatic, and unexpected economic or geopolitical developments can change market sentiment quickly.
For the current setup, however, the technical picture remains constructive while gold holds above 4,151. Traders should monitor whether the market can sustain its strength without a decisive breakdown below support.
Gold Intraday Forecast Support and Resistance Levels
The key levels in the current Gold Intraday Forecast define the preferred bullish path and the alternative bearish scenario.
Key Pivot Support: 4,151
The primary support level is 4,151. As long as gold remains above this pivot, the bullish scenario remains preferred.
A sustained break below 4,151 would weaken the current structure and suggest that sellers are gaining control.
First Upside Target: 4,240
The first bullish objective is 4,240. Reaching this level would represent a significant continuation of the current upward move.
Because gold is already trading above its upper Bollinger Band, traders should also watch for profit-taking or consolidation as price approaches the target.
Second Upside Target: 4,264
If buyers maintain control and gold extends its move beyond 4,240, the next target becomes 4,264.
A sustained advance toward this level would support the bullish continuation scenario.
Alternative Downside Target: 4,112
A decisive break below 4,151 would weaken the preferred bullish outlook and expose 4,112 as the first alternative downside objective.
Second Alternative Downside Target: 4,088
If selling pressure continues below 4,112, gold could extend its decline toward 4,088.
Key Levels Summary
- Pivot / Support: 4,151
- Target A: 4,240
- Target B: 4,264
- Alternative Target A: 4,112
- Alternative Target B: 4,088
- 20-period moving average: 4,172
- 50-period moving average: 4,174
- Upper Bollinger Band: 4,189
Gold Intraday Forecast Trading Scenario Analysis
The preferred Gold Intraday Forecast remains bullish while 4,151 holds as support. The positive momentum indicators favor buyers, although the move above the upper Bollinger Band makes short-term price behavior especially important.
Bullish Continuation Scenario
If gold maintains support above 4,151, buyers could continue pushing the price toward 4,240.
The RSI above 50 and MACD above its signal line in positive territory support this possibility. Price trading above both moving averages also reinforces the bullish structure.
A sustained move beyond 4,240 could open the way toward 4,264. Confirmation would be stronger if price continues to hold above its moving averages and buying momentum remains positive.
The preferred bullish path is:
4,151 support → 4,240 → 4,264
Pullback and Consolidation Scenario
Gold’s position above the upper Bollinger Band at 4,189 suggests that upward pressure is strong, but the market may be vulnerable to a temporary retracement.
Profit-taking could lead to consolidation or a pullback toward the moving-average area around 4,172–4,174. Such a move would not automatically invalidate the bullish scenario.
The key consideration is whether buyers can defend the broader support structure and prevent the pullback from developing into a sustained decline below 4,151. Traders should avoid interpreting every short-term correction as a confirmed trend reversal.
Bearish Alternative Scenario
The bullish outlook would weaken if gold breaks decisively below 4,151 and sustains trading beneath the pivot.
In that situation, sellers could push the price toward 4,112, followed by 4,088 if downward pressure intensifies.
The alternative bearish path is:
Below 4,151 → 4,112 → 4,088
A sustained breakdown would be more significant than a brief intraday move below support, particularly if price also falls beneath the moving averages and momentum indicators deteriorate.
Gold Intraday Forecast Risk Factors and Alternative Outlook
The main risk to the bullish Gold Intraday Forecast is a sustained break below 4,151. Such a move would weaken the preferred scenario and could expose the downside targets at 4,112 and 4,088.
Another consideration is gold trading above its upper Bollinger Band. Although this can occur during a strong trend, it may also signal that price has moved rapidly relative to its recent volatility. A return inside the bands could therefore occur without necessarily confirming a broader bearish reversal.
Traders should also monitor the moving averages at 4,172 and 4,174. Losing these levels may indicate that immediate buying pressure is easing, although the pivot at 4,151 remains the main boundary in the supplied setup.
External risks include sharp US dollar movements, changes in Treasury yields, unexpected economic releases, and shifts in safe-haven demand. These factors can trigger sudden price movements and cause technical levels to break.
Risk management remains essential. The RSI, MACD, moving averages, and Bollinger Bands provide complementary information, but none guarantees a specific market outcome. Traders should account for volatility, position size, and the possibility of false breakouts.
Gold Intraday Forecast Conclusion
The Gold Intraday Forecast favors further upside while 4,151 remains support, with 4,240 and 4,264 as the primary targets.
The technical structure is bullish: the RSI is above 50, the MACD is above its signal line and positive, and gold is trading above its 20-period and 50-period moving averages. Price above the upper Bollinger Band at 4,189 further indicates strong upward pressure, although a temporary pullback or consolidation remains possible.
If buyers maintain control, gold could advance toward 4,240 and potentially extend the move to 4,264. Conversely, a decisive break below 4,151 would weaken the preferred outlook and shift attention toward 4,112 and 4,088.
Overall, 4,151 remains the decisive pivot for this intraday setup. Above it, the preferred path remains bullish. Below it, the alternative bearish scenario becomes more relevant.
FAQ
What is the current Gold Intraday Forecast?
The Gold Intraday Forecast favors further upside while gold remains above 4,151, with targets at 4,240 and 4,264.
Why is 4,151 important for gold?
The 4,151 level is the key pivot support. Holding above it preserves the preferred bullish scenario, while a sustained break below it could expose lower targets.
What are the main upside targets for gold?
The first upside target is 4,240, followed by 4,264 if buyers maintain control.
What do the RSI and MACD indicate?
The RSI is above 50, and the MACD is above its signal line and positive. Both readings support the current bullish momentum.
What does gold trading above the upper Bollinger Band mean?
It indicates strong upward price pressure, but it can also precede consolidation or a temporary pullback. It does not, by itself, guarantee that prices will continue rising.
What happens if gold breaks below 4,151?
A decisive break below 4,151 would weaken the bullish outlook and could open the way toward 4,112 and 4,088.

