
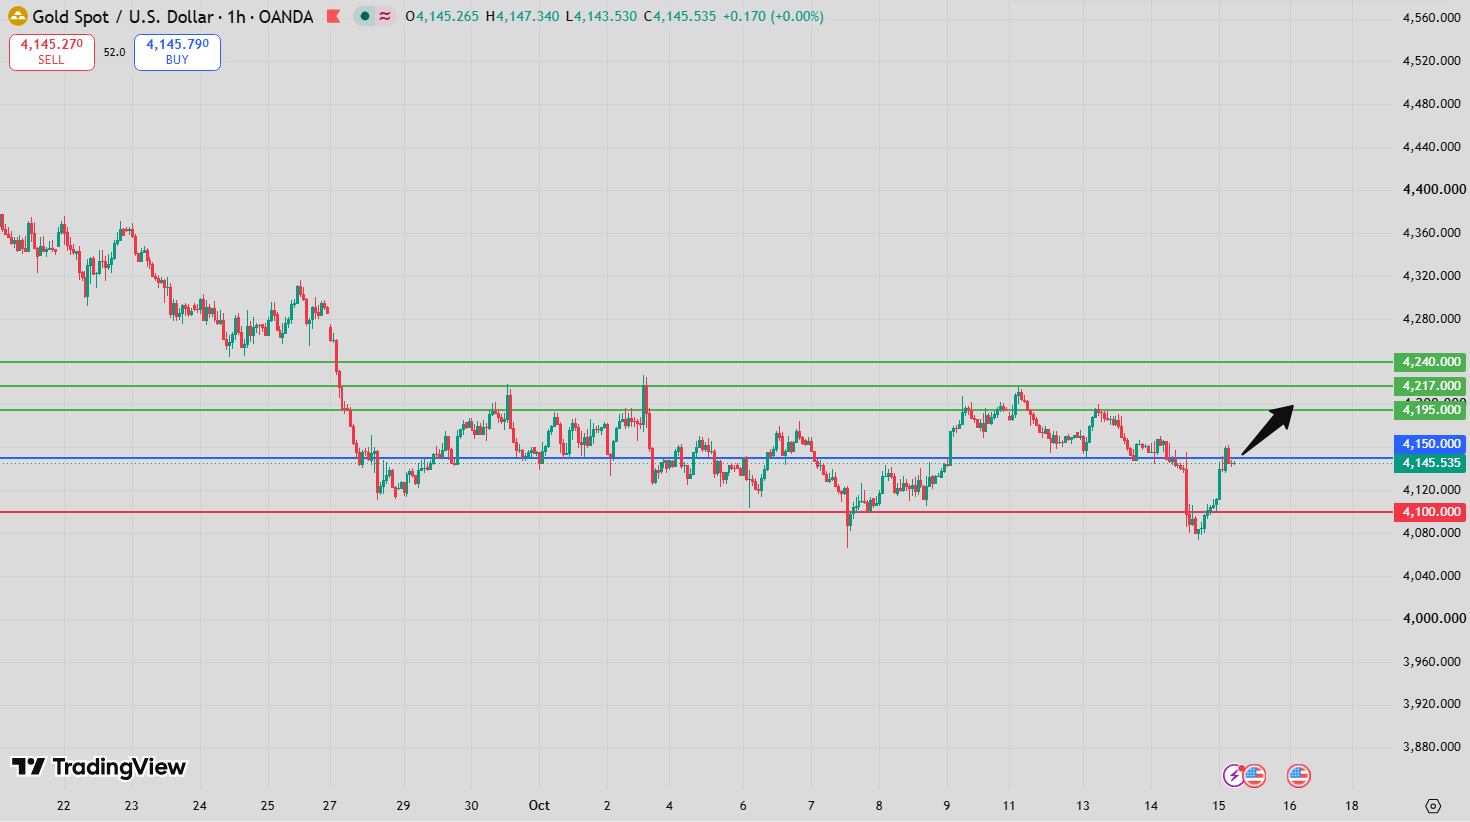
Gold Intraday Forecast: Upside Toward 4,195 and 4,217 While 4,110 Holds
Introduction
The latest Gold Intraday Forecast favors further upside as long as the key support level at 4,110 remains intact. The primary scenario targets 4,195 as the first upside objective, followed by 4,217 if buyers maintain control and bullish momentum continues.
The technical indicators support this constructive outlook. The Relative Strength Index (RSI) is above its neutral level of 50, suggesting that positive momentum remains present. Meanwhile, the MACD is above its signal line and in positive territory, reinforcing the bullish bias.
Gold is also trading above both its 20-period moving average at 4,125 and its 50-period moving average at 4,124. This positioning indicates that the short-term price structure remains favorable to buyers. Nevertheless, the 4,110 pivot is the critical level separating the preferred bullish scenario from the alternative bearish outlook.
A sustained break below this support would weaken the current setup and shift attention toward 4,073 and 4,051.
Gold Intraday Forecast Technical Analysis
The Gold Intraday Forecast remains bullish while gold holds above 4,110. The combination of positive momentum indicators and price trading above both moving averages supports the possibility of continued upside.
The primary technical path is:
Above 4,110 → 4,195 → 4,217
The RSI above 50 indicates that buying momentum remains stronger than the neutral threshold commonly used to assess short-term market conditions. Although the RSI alone cannot guarantee a continued advance, it supports the view that bullish momentum remains active.
The MACD provides additional confirmation. With the indicator above its signal line and in positive territory, the current momentum configuration favors buyers. A continued positive MACD structure would reinforce the possibility of gold advancing toward the first target.
Moving-average positioning is also constructive. Gold is trading above the 20-period average at 4,125 and the 50-period average at 4,124. These nearby averages may act as short-term reference levels during any temporary pullback.
As long as the market remains above 4,110, the preferred outlook is for gold to test 4,195 and potentially extend toward 4,217. A decisive break below the pivot, however, would invalidate the immediate bullish scenario.
Gold Intraday Forecast Market Sentiment Analysis
Market sentiment in the current Gold Intraday Forecast is cautiously bullish. The RSI above 50, positive MACD, and price above both moving averages indicate that the technical balance currently favors buyers.
The close positioning of the 20-period and 50-period moving averages around 4,124–4,125 provides an important short-term reference zone. If gold pulls back toward these averages and buyers defend the area, the market could regain upward momentum.
However, a bullish technical configuration does not eliminate the risk of a correction. Traders should monitor whether gold can maintain its position above the moving averages and preserve the 4,110 pivot.
Broader market sentiment may also be influenced by movements in the US dollar, Treasury yields, Federal Reserve policy expectations, inflation data, and demand for safe-haven assets. These factors can strengthen or weaken gold’s advance, particularly around important economic announcements.
For broader context, traders can follow FastPip market analysis and review upcoming releases through the Forex Factory economic calendar.
Gold Intraday Forecast Support and Resistance Levels
Key Pivot Support: 4,110
The 4,110 level is the principal support for the current setup. As long as gold remains above this pivot, the bullish scenario remains preferred.
A decisive break below 4,110 would weaken the technical structure and bring the alternative downside targets into focus.
Short-Term Moving-Average Zone: 4,124–4,125
Gold is trading above its 20-period moving average at 4,125 and its 50-period moving average at 4,124.
This narrow zone may provide intermediate support during a pullback. A sustained move below both averages would suggest that short-term buying momentum is weakening, although the 4,110 pivot remains the main level defining the scenario.
First Upside Target: 4,195
The first bullish objective is 4,195. As gold approaches this level, traders should watch for potential profit-taking or a temporary pause in the advance.
A sustained move toward and beyond this target would support the continuation scenario.
Second Upside Target: 4,217
If buyers maintain control above the first target, the next objective is 4,217. A move toward this level would represent a further extension of the bullish intraday structure.
Alternative Downside Target: 4,073
If gold breaks decisively below 4,110, the first bearish objective becomes 4,073.
Second Alternative Downside Target: 4,051
Continued selling below 4,073 could expose 4,051, indicating a deeper correction.
Key Levels Summary
- Pivot / Support: 4,110
- 20-period moving average: 4,125
- 50-period moving average: 4,124
- Target A: 4,195
- Target B: 4,217
- Alternative Target A: 4,073
- Alternative Target B: 4,051
Gold Intraday Forecast Trading Scenario Analysis
Bullish Continuation Scenario
The preferred scenario remains bullish while gold holds above 4,110. The RSI above 50 and positive MACD support the possibility of further gains.
If buyers maintain control and price continues advancing, 4,195 is the first objective. A decisive move beyond this level could open the way toward 4,217.
Sustained price action is more meaningful than a brief spike above resistance, so traders should monitor whether gold can hold its gains as it approaches each target.
Pullback and Consolidation Scenario
Gold may experience a temporary pullback toward the moving-average zone around 4,124–4,125 before making its next directional move.
If buyers defend this area and the price remains above 4,110, the correction would not automatically invalidate the bullish outlook. A recovery from the moving averages could provide renewed momentum toward 4,195.
However, a sustained decline below the moving averages would indicate weakening short-term momentum and make the pivot increasingly important.
Bearish Alternative Scenario
The bearish scenario becomes active if gold decisively breaks below 4,110.
Such a move would undermine the preferred bullish structure and shift attention toward 4,073. If selling pressure continues below that level, the next downside objective would be 4,051.
Traders should distinguish between a brief move below support and a sustained breakdown. Continued trading below the pivot would provide stronger evidence that sellers have taken control.
Gold Intraday Forecast Risk Factors and Alternative Outlook
The main risk to the bullish Gold Intraday Forecast is a decisive break below 4,110. If this support fails, the expected advance toward 4,195 and 4,217 would become less likely, while 4,073 and 4,051 would become the key downside objectives.
Another risk is a loss of momentum near the first upside target. Profit-taking around 4,195 could temporarily interrupt the advance, particularly if buyers struggle to sustain price above short-term resistance.
Changes in the US dollar, Treasury yields, inflation expectations, Federal Reserve guidance, and geopolitical conditions can also influence gold’s direction. Unexpected economic data may increase volatility and cause price to move rapidly around the key technical levels.
The RSI and MACD provide useful context but should not be treated as guarantees. Traders should evaluate the indicators alongside price action, support and resistance, and appropriate risk-management rules.
Gold Intraday Forecast Conclusion
The Gold Intraday Forecast remains bullish while 4,110 holds as support. The main upside targets are 4,195 and 4,217, supported by the RSI above 50, the MACD above its signal line and in positive territory, and gold trading above both its 20-period and 50-period moving averages.
A pullback toward the 4,124–4,125 moving-average zone may occur, but the bullish scenario remains viable as long as the key pivot is protected. A decisive break below 4,110 would invalidate the preferred outlook and shift attention toward 4,073 and 4,051.
For intraday traders, the key is to monitor whether buyers can preserve support and maintain positive momentum as gold approaches the first upside objective.
FAQ
What is the current Gold Intraday Forecast?
The outlook favors further upside while gold remains above 4,110, with targets at 4,195 and 4,217.
What are the main upside targets for gold?
The first target is 4,195, followed by 4,217 if bullish momentum continues.
What do the RSI and MACD indicate?
The RSI is above 50, while the MACD is above its signal line and positive. Both indicators support the current bullish bias.
How do the moving averages support the forecast?
Gold is trading above its 20-period moving average at 4,125 and its 50-period moving average at 4,124, indicating a constructive short-term structure.
What happens if gold breaks below 4,110?
A decisive break below 4,110 would weaken the bullish outlook and expose 4,073 and 4,051 as the alternative downside targets.

