
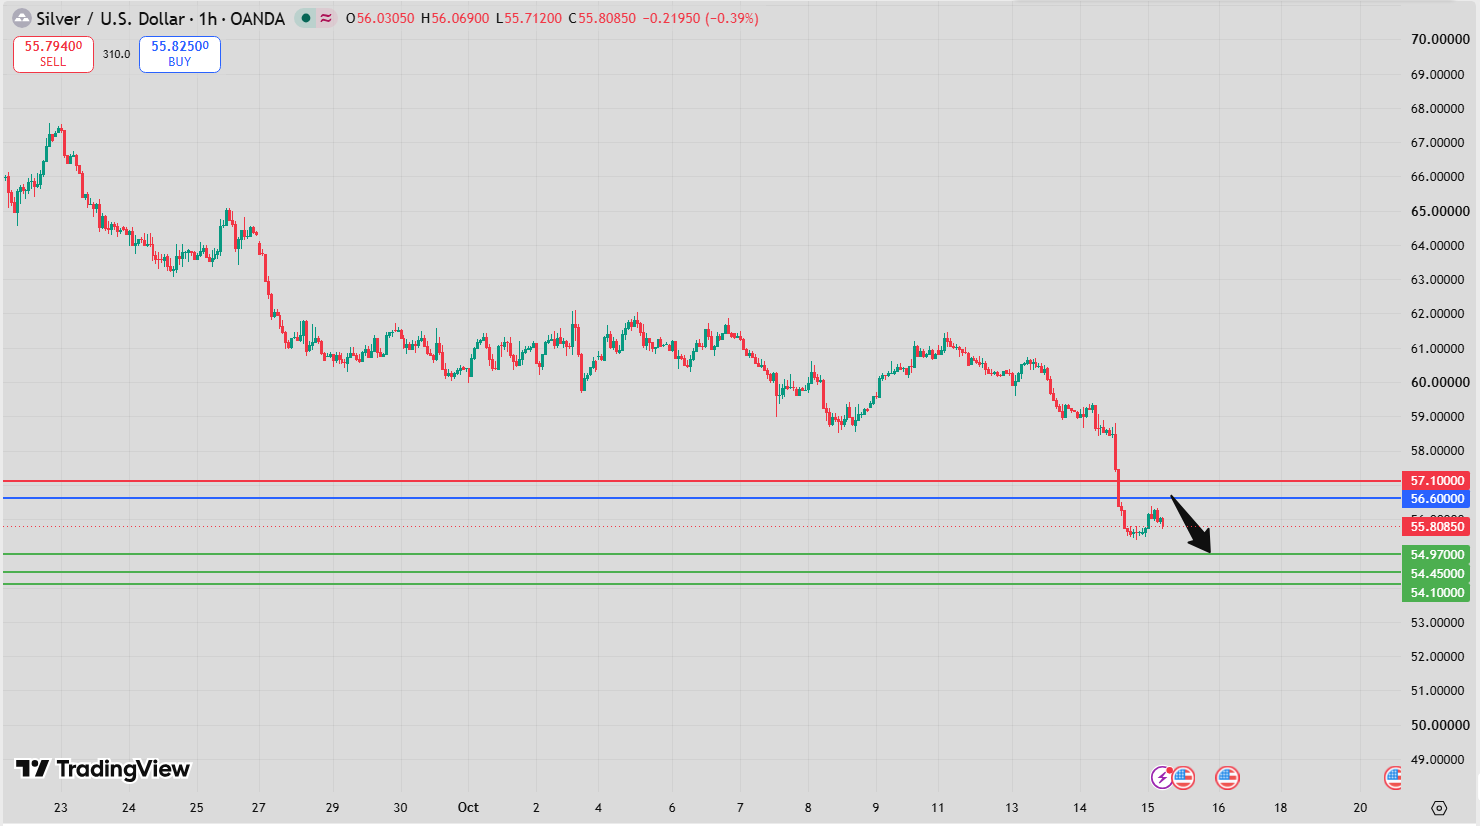
Silver Intraday Forecast: Downside Toward 54.97 and 54.45 Below 56.94 Resistance
Introduction
The latest Silver Intraday Forecast favors further downside as long as 56.94 continues to act as resistance. The primary scenario targets 54.97 as the first downside objective, followed by 54.45 if selling pressure intensifies and the market establishes a sustained break below the initial target.
The technical picture presents a mixed but predominantly bearish structure. The Relative Strength Index (RSI) is below its neutral level of 50, indicating that bearish momentum remains influential. Meanwhile, the MACD is above its signal line but remains in negative territory, suggesting that downside momentum may be moderating without confirming a complete bullish reversal.
Silver is trading above its 20-period moving average at 55.86, but below its 50-period moving average at 56.89. This positioning suggests that short-term price action has shown some resilience, although the broader intraday structure remains under pressure beneath the key 56.94 pivot.
A sustained break above 56.94 would weaken the bearish outlook and shift attention toward 57.82 and 58.34. Until that happens, the preferred scenario remains bearish.
Silver Intraday Forecast Technical Analysis
The Silver Intraday Forecast remains bearish while 56.94 acts as resistance. This level is particularly important because it sits just above the 50-period moving average at 56.89, creating a nearby technical zone that buyers must overcome to improve the short-term outlook.
The primary technical path is:
Below 56.94 → 54.97 → 54.45
The RSI below 50 indicates that sellers retain an advantage in terms of relative momentum. Although the indicator does not predict the next move with certainty, its position below the neutral threshold supports the current downside bias.
The MACD requires a more nuanced interpretation. It remains negative, meaning the broader momentum reading is still below zero, but its position above the signal line may indicate that selling pressure has started to ease. This divergence between the RSI and MACD suggests that silver could experience short-term consolidation or a temporary rebound before its next directional move.
Moving-average positioning also highlights the market’s mixed structure. Silver is above the 20-period average at 55.86, which may provide intermediate support during a pullback, but remains below the 50-period average at 56.89. The nearby 56.89–56.94 zone therefore represents an important resistance area.
As long as silver fails to reclaim this zone, the downside targets at 54.97 and 54.45 remain relevant.
Silver Intraday Forecast Market Sentiment Analysis
Market sentiment in the current Silver Intraday Forecast remains cautious, with the overall technical bias favoring sellers despite signs that downward momentum may be slowing.
The RSI below 50 indicates that bullish momentum has not yet regained control. This supports the view that recoveries may encounter selling pressure, particularly near the 50-period moving average and the 56.94 pivot.
However, the MACD being above its signal line while still negative suggests that the bearish trend may be losing some momentum. This configuration can precede a consolidation phase or a corrective rebound, although it does not independently establish a bullish reversal.
The market’s reaction around 55.86 and the resistance zone near 56.89–56.94 will therefore be important. If silver remains below the pivot, sellers retain the advantage. If buyers reclaim and sustain movement above 56.94, the alternative upside scenario becomes more credible.
Broader factors can also influence silver, including US dollar movements, Treasury yields, Federal Reserve policy expectations, industrial demand, and changes in global risk sentiment. Traders can follow broader developments through FastPip market analysis and monitor scheduled economic releases using the Forex Factory economic calendar.
Silver Intraday Forecast Support and Resistance Levels
Key Pivot Resistance: 56.94
The 56.94 level is the main resistance controlling the current outlook. As long as silver remains below this level, the bearish scenario remains preferred.
A decisive and sustained breakout above the pivot would weaken the downside structure and shift attention toward the alternative upside targets.
Intermediate Moving-Average Support: 55.86
The 55.86 level corresponds to the 20-period moving average. Since silver is trading above this average, it may act as an intermediate support reference during short-term pullbacks.
A sustained move below it could indicate that the market is losing this near-term support, although the 56.94 pivot remains the primary level defining the overall scenario.
50-Period Moving-Average Resistance: 56.89
The 56.89 level represents the 50-period moving average. Silver is currently below this average, which reinforces the importance of the nearby resistance zone.
A recovery above 56.89 would be an early sign of improving price structure, but a sustained break above 56.94 would provide a clearer challenge to the bearish outlook.
First Downside Target: 54.97
The first bearish objective is 54.97. As silver approaches this level, traders should monitor whether the market continues to decline or begins to stabilize.
Profit-taking by short sellers could trigger a temporary rebound near the target. However, such a reaction would not necessarily invalidate the bearish structure if the price remains below 56.94.
Second Downside Target: 54.45
If silver breaks decisively below 54.97, the next downside objective becomes 54.45. A sustained move toward this level would indicate that sellers have maintained control despite potential buying interest near the first target.
Alternative Upside Target: 57.82
A sustained breakout above 56.94 would activate the alternative bullish scenario, with 57.82 as the first upside objective.
Second Alternative Upside Target: 58.34
If buying pressure continues beyond 57.82, silver could extend its recovery toward 58.34.
Key Levels Summary
- Pivot / Resistance: 56.94
- 20-period moving average: 55.86
- 50-period moving average: 56.89
- Target A: 54.97
- Target B: 54.45
- Alternative Target A: 57.82
- Alternative Target B: 58.34
Silver Intraday Forecast Trading Scenario Analysis
Bearish Continuation Scenario
The preferred scenario remains bearish while silver trades below 56.94. The first downside objective is 54.97, followed by 54.45 if selling pressure continues and the market establishes a sustained break below the initial target.
The RSI below 50 supports this outlook. Although the MACD is above its signal line, its negative reading indicates that momentum has not fully shifted into bullish territory.
Traders should monitor whether rallies toward the 50-period moving average and the pivot encounter renewed selling pressure.
Pullback and Consolidation Scenario
Silver may consolidate or rebound temporarily because the MACD is above its signal line and the price remains above the 20-period moving average at 55.86.
A recovery toward 56.89–56.94 would bring the market into a key resistance zone. If sellers defend this area, the rebound could fade and the downside scenario could resume.
If price instead breaks and sustains movement above 56.94, the technical outlook would become more favorable for buyers.
Bullish Alternative Scenario
The alternative scenario becomes active if silver decisively breaks above 56.94.
Such a move would challenge the current bearish structure and could open the way toward 57.82. If buyers maintain control above this first upside objective, the next target would be 58.34.
A brief spike above resistance would be less convincing than sustained price action above the pivot. Confirmation is important because the current RSI reading remains below 50.
Silver Intraday Forecast Risk Factors and Alternative Outlook
The main risk to the bearish Silver Intraday Forecast is a sustained breakout above 56.94. Such a move would weaken the preferred downside scenario and could trigger a recovery toward 57.82 and 58.34.
The MACD configuration is another factor to monitor. Because the indicator is above its signal line despite remaining negative, the market may experience a corrective rebound before establishing its next direction. Traders should avoid interpreting this signal alone as proof that the downtrend has ended.
On the downside, a decisive break below 54.97 would strengthen the case for a move toward 54.45. However, the first target could attract profit-taking and produce a temporary recovery.
External factors—including US dollar strength, Treasury yields, industrial-demand expectations, and unexpected economic or geopolitical developments—may also increase volatility in precious metals.
Traders should evaluate the technical levels alongside current price action and maintain appropriate risk management. The forecast describes conditional scenarios rather than guaranteed outcomes.
Silver Intraday Forecast Conclusion
The Silver Intraday Forecast favors further downside while 56.94 remains resistance. The primary targets are 54.97 and 54.45, supported by the RSI below 50 and price trading below the 50-period moving average.
However, the MACD remains above its signal line while negative, and silver is above its 20-period moving average at 55.86. These conditions leave room for consolidation or a temporary rebound, particularly if the market approaches the first downside target.
A decisive break below 54.97 would strengthen the bearish continuation scenario toward 54.45. Conversely, a sustained breakout above 56.94 would shift attention toward 57.82 and 58.34.
For intraday traders, 56.94 remains the decisive pivot, while the reaction around 54.97 will help determine whether the decline continues or pauses.
FAQ
What is the current Silver Intraday Forecast?
The outlook remains bearish while silver trades below 56.94, with downside targets at 54.97 and 54.45.
What is the first downside target for silver?
The first target is 54.97. Price may stabilize or experience a temporary rebound as it approaches this level.
What does the current RSI indicate?
The RSI is below 50, suggesting that bearish momentum remains influential in the current intraday setup.
Why is the MACD important in this forecast?
The MACD is above its signal line but remains negative. This may indicate that selling pressure is easing, but it does not yet confirm a full bullish reversal.
What happens if silver breaks above 56.94?
A decisive and sustained breakout above 56.94 would weaken the bearish outlook and expose 57.82 and 58.34 as alternative upside targets.

