
USD/CAD Intraday Forecast: Downside Toward 1.3753 and 1.3740 While 1.3806 Holds
Introduction
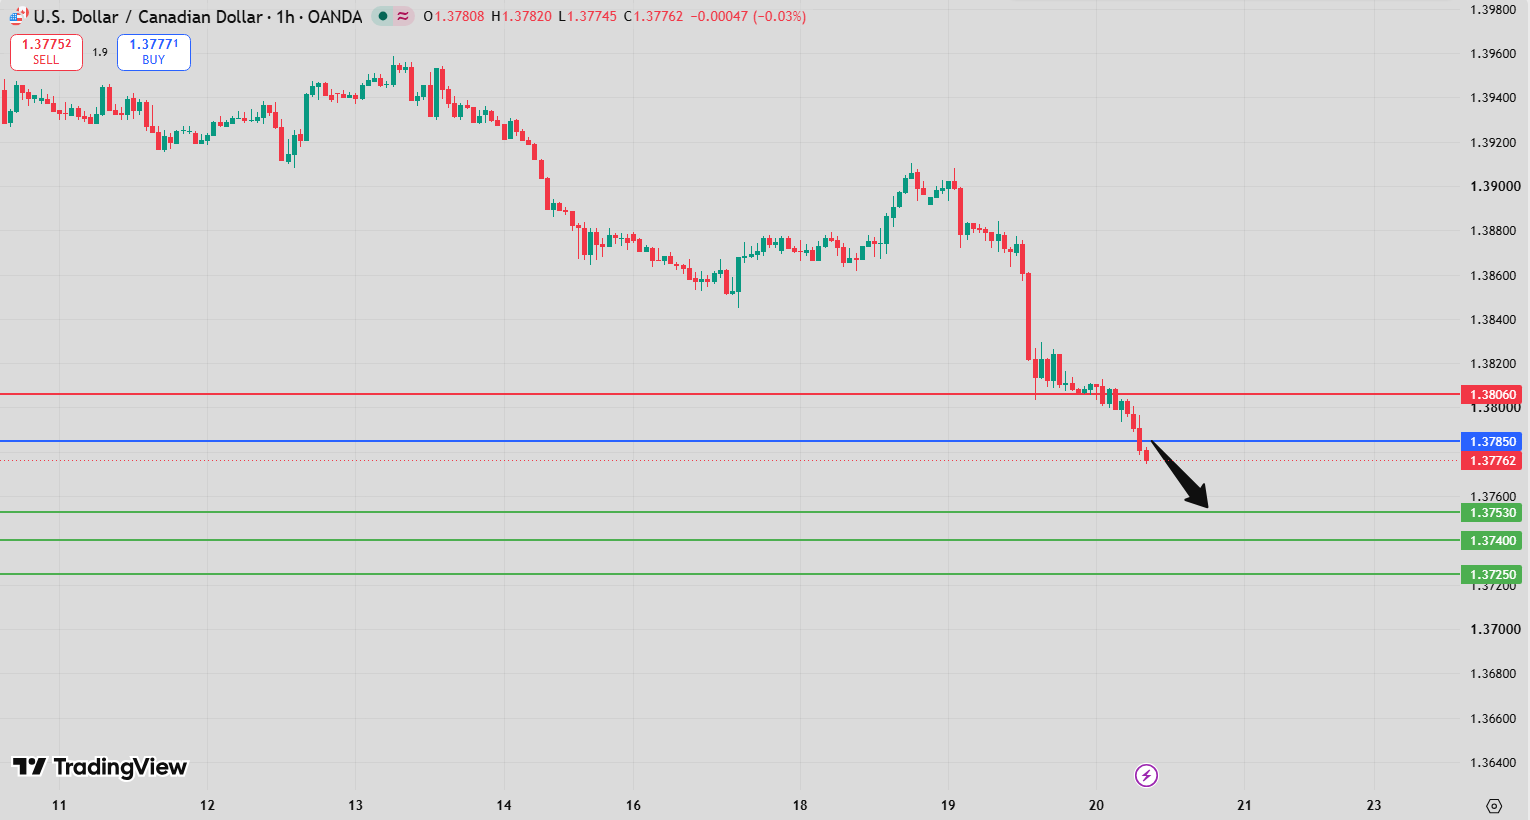
The USD/CAD Intraday Forecast remains bearish as long as 1.3806 continues to act as resistance. The current technical structure favors further downside, with 1.3753 as the first target and 1.3740 as the second objective.
However, the market is approaching an important technical condition. The RSI has fallen below 30, placing USD/CAD in oversold territory. This can occur during a strong and persistent downtrend, but it can also increase the probability of a short-term rebound, particularly if a bullish divergence begins to develop.
The MACD remains negative and below its signal line, while price is trading below both the 20-period and 50-period moving averages. USD/CAD is also below its lower Bollinger Band, confirming the strength of the current downside pressure but simultaneously highlighting the possibility of a technical retracement.
The key level remains 1.3806. As long as this resistance holds, the downside remains the preferred scenario.
USD/CAD Intraday Forecast Technical Analysis
The USD/CAD Intraday Forecast favors the downside while 1.3806 remains resistance.
The preferred technical path is:
Below 1.3806 → 1.3753 → 1.3740
The first target at 1.3753 represents the primary downside objective. If sellers maintain control and the pair breaks through this level, the next target becomes 1.3740.
The RSI below 30 indicates that USD/CAD is currently oversold. This is an important warning for short-term traders because an oversold reading does not necessarily mean that the downtrend has ended. Strong bearish trends can remain oversold for extended periods.
The MACD is below its signal line and negative, supporting the bearish structure.
Price is also below the 20-period moving average around 1.3802 and the 50-period moving average near 1.3824, reinforcing the downside bias.
At the same time, USD/CAD is trading below its lower Bollinger Band around 1.3785, showing that selling pressure remains strong.
USD/CAD Intraday Forecast Market Sentiment Analysis
The USD/CAD Intraday Forecast currently reflects negative market sentiment, with sellers maintaining control below 1.3806.
The pair can react significantly to changes in the US dollar, oil prices, interest-rate expectations and economic data from both the United States and Canada.
Important market drivers include:
- US dollar movements.
- Federal Reserve policy expectations.
- Bank of Canada policy expectations.
- Crude oil price movements.
- US economic data.
- Canadian economic data.
- Interest-rate differentials.
- Global risk sentiment.
The technical configuration remains bearish, but the oversold RSI introduces an important element of uncertainty.
If the RSI remains below 30 while price continues declining, it would indicate that bearish momentum is still dominant. Conversely, if price begins stabilizing while the RSI recovers or forms a bullish divergence, the probability of a short-term rebound would increase.
USD/CAD Intraday Forecast Support and Resistance Levels
The key levels in today’s USD/CAD Intraday Forecast are clearly defined.
Key Pivot Resistance: 1.3806
The main technical resistance is:
1.3806
As long as USD/CAD remains below this level, the bearish scenario remains valid.
First Target: 1.3753
The primary downside objective is:
1.3753
A break toward this level would confirm continued selling pressure.
Second Target: 1.3740
If sellers successfully push below the first target, the next objective becomes:
1.3740
Alternative Upside Level: 1.3827
A sustained break above 1.3806 would weaken the bearish setup and expose:
1.3827
Second Alternative Target: 1.3839
Further upside momentum could then lead toward:
1.3839
USD/CAD Intraday Forecast Trading Scenario Analysis
According to the USD/CAD Intraday Forecast, the preferred scenario remains bearish below 1.3806.
Bearish Continuation Scenario
The primary path is:
Below 1.3806 → 1.3753 → 1.3740
As long as 1.3806 remains resistance, sellers retain control of the short-term structure.
A move toward 1.3753 would represent the first downside objective. A sustained break below this level could extend the decline toward 1.3740.
Oversold Rebound Scenario
The RSI below 30 creates the possibility of a short-term technical rebound.
If buyers begin returning to the market, USD/CAD could recover toward the 1.3806 resistance zone.
However, an oversold RSI alone is not enough to confirm a reversal. The broader structure remains bearish while price stays below the pivot.
A bullish divergence between price and RSI would provide a stronger warning that downside momentum may be weakening.
Bearish Continuation After Rebound
USD/CAD could temporarily recover from oversold conditions without changing the broader trend.
If the pair rebounds but fails to break above 1.3806, sellers could regain control and push the market back toward 1.3753 and 1.3740.
Bullish Alternative Scenario
The alternative scenario becomes active above 1.3806.
A sustained break above the pivot would weaken the current bearish structure and could lead toward 1.3827, followed by 1.3839.
USD/CAD Intraday Forecast Risk Factors and Alternative Outlook
The main risk to the USD/CAD Intraday Forecast is the extremely oversold technical condition.
An RSI below 30 can remain in oversold territory during a powerful downtrend, but it can also precede a short-term recovery.
The main risks include:
- A bullish RSI divergence.
- Sudden US dollar weakness.
- Strong crude oil gains.
- Changes in Federal Reserve expectations.
- Changes in Bank of Canada expectations.
- Unexpected US economic data.
- Unexpected Canadian economic data.
- Short covering after the recent decline.
The most important technical warning for the bearish scenario would be a sustained break above 1.3806.
Until that occurs, the downside remains the preferred direction.
USD/CAD Intraday Forecast Conclusion
The USD/CAD Intraday Forecast remains bearish below 1.3806, with 1.3753 as the first target and 1.3740 as the second downside objective.
The technical structure remains negative. The MACD is below its signal line and negative, while price is below both the 20-period and 50-period moving averages.
However, the RSI below 30 indicates that USD/CAD is oversold. This means traders should remain alert to the possibility of a temporary rebound or bullish divergence.
The pair is also trading below its lower Bollinger Band, highlighting strong selling pressure while simultaneously increasing the possibility of short-term mean reversion.
The key resistance remains 1.3806. As long as this level holds, the bearish scenario remains intact.
Conversely, a sustained break above 1.3806 would shift attention toward 1.3827 and 1.3839.
Overall, the technical balance favors sellers, but the oversold condition makes the reaction around 1.3753 and 1.3806 particularly important.
FAQ
What is the current USD/CAD Intraday Forecast?
The USD/CAD Intraday Forecast remains bearish below 1.3806, with targets at 1.3753 and 1.3740.
Why is 1.3806 important?
It is the key pivot resistance. Holding below this level keeps the bearish scenario active.
What does the RSI below 30 mean?
It indicates that USD/CAD is oversold. This can occur during a strong downtrend but can also increase the probability of a technical rebound.
Could USD/CAD rebound from current levels?
Yes. A short-term rebound is possible, particularly if bullish RSI divergence develops. However, the bearish structure remains intact while 1.3806 acts as resistance.
What happens above 1.3806?
A sustained break above the pivot could expose 1.3827 and 1.3839.
What are the downside targets?
The first target is 1.3753, followed by 1.3740.

