The RSI Indicator (Relative Strength Index) is a technical momentum oscillator used to measure the speed and magnitude of recent price movements in financial markets. It helps traders evaluate market momentum, identify potentially overbought or oversold conditions, and detect possible trend reversals.
Developed by J. Welles Wilder Jr. in 1978, the Relative Strength Index operates on a scale from 0 to 100. Traders commonly interpret readings above 70 as overbought and readings below 30 as oversold.
The RSI Indicator is widely used in Forex, stocks, commodities, cryptocurrencies, and indices. It is particularly useful when combined with price action, support and resistance levels, and other technical indicators.
Unlike trend-following indicators that primarily identify market direction, RSI focuses on momentum and the relative strength of recent price gains and losses within the same instrument.
The RSI Indicator compares average price gains with average price losses over a specified number of periods.
The standard setting is 14 periods, although traders can adjust this parameter depending on their strategy and trading timeframe.
For example:
The indicator appears in a separate window below the price chart and fluctuates between 0 and 100.
| RSI Value | Market Interpretation |
|---|---|
| 70–100 | Potentially overbought; strong bullish momentum |
| 50–70 | Generally positive momentum |
| 50 | Momentum reference or centerline |
| 30–50 | Generally negative momentum |
| 0–30 | Potentially oversold; strong bearish momentum |
These levels are reference points rather than guaranteed buy or sell signals.
An RSI reading above 70 does not necessarily mean prices will decline. Likewise, an RSI reading below 30 does not guarantee a bullish reversal.
During strong market trends, RSI can remain at extreme levels for extended periods.
The Relative Strength Index is calculated using the relationship between average gains and average losses.
The standard formula is:
RSI = 100 – (100/(+RS))
Where:
RS = Average Gain / Average Loss
The traditional RSI calculation uses Wilder’s smoothing method after the initial averages are established.
Suppose the average gain over the selected calculation period is 1.5 points, while the average loss is 0.5 points.
Step 1: Calculate Relative Strength
RS= 1.5/0.5 = 3
Step 2: Calculate RSI
For a more detailed explanation of the calculation method, traders can consult StockCharts’ Relative Strength Index guide.
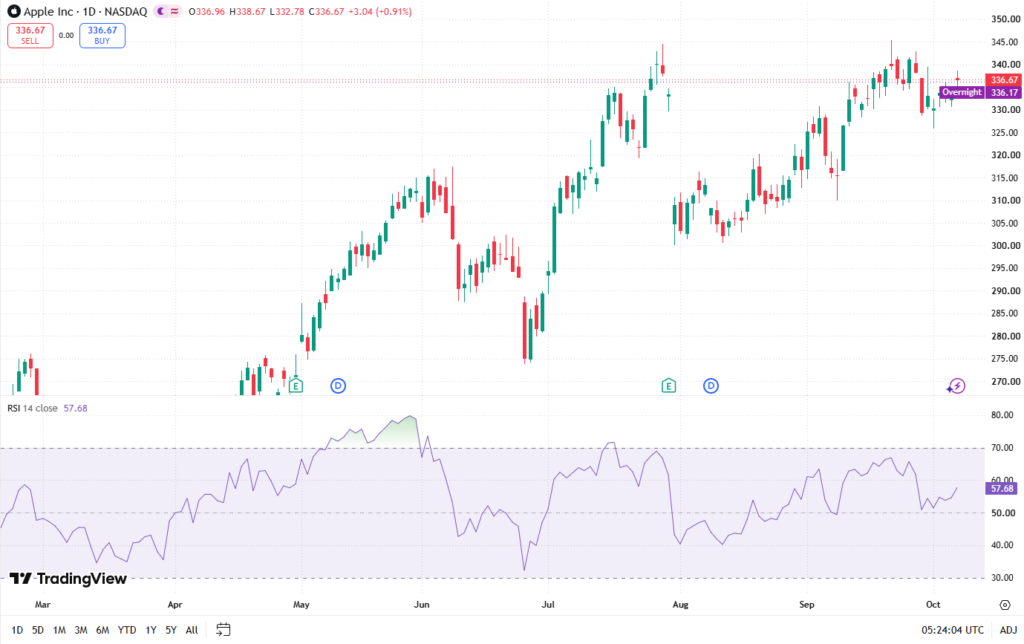
Traders use several RSI techniques to analyze potential market opportunities.
An RSI reading above 70 traditionally indicates overbought conditions.
This means recent price gains have been relatively strong compared with losses.
Possible interpretations include:
Nevertheless, strongly trending markets can remain overbought while prices continue rising.
An RSI reading below 30 traditionally indicates oversold conditions.
This suggests recent losses have been relatively strong compared with gains.
Potential interpretations include:
Traders should avoid treating oversold readings as automatic buying opportunities.
The 50 level acts as an important momentum reference.
Bullish Centerline Crossover
When RSI moves above 50, it may indicate that positive price momentum is becoming stronger.
Bearish Centerline Crossover
When RSI drops below 50, it may indicate increasing negative momentum.
Centerline crossovers are often used to confirm trends rather than predict exact turning points.
RSI divergence occurs when price movements and RSI movements fail to confirm each other.
Divergence analysis can help identify weakening momentum and possible changes in market direction.
Bullish divergence occurs when:
This indicates that price has continued declining while downward momentum has weakened.
A bullish divergence may suggest a potential recovery, especially near an established support level.
Bearish divergence occurs when:
This suggests that upward price momentum may be weakening even though the market has reached a new high.
A bearish divergence can precede a correction or reversal.
However, divergences may persist or fail, particularly during strong directional markets. Confirmation from price structure or other indicators remains important.
Charles Schwab’s RSI educational guide also explains the interpretation of overbought, oversold, and divergence signals.
RSI can support different trading approaches depending on market conditions, volatility, and timeframes.
This approach focuses on potential price reversals around the traditional RSI thresholds.
A typical bullish setup might involve:
Price producing an additional bullish confirmation signal.
A bearish setup can follow the opposite logic near resistance.
This approach may be more suitable for range-bound markets than strongly trending markets.
Traders may combine RSI with a moving average to evaluate trend direction.
For example:
Price above the 200-period moving average with RSI above 50 may support a bullish trend interpretation.
Price below the 200-period moving average with RSI below 50 may support a bearish trend interpretation.
These conditions can help traders filter trades that conflict with the broader market trend.
Divergence traders look for discrepancies between price structure and momentum.
A possible bullish setup may include:
The opposite conditions may support a bearish setup.
Divergence signals should be validated against market context, volatility, and broader trend conditions.
The 14-period setting is the traditional default, but traders sometimes use shorter or longer calculation periods.
| Trading Style | Example RSI Setting | Characteristics |
|---|---|---|
| Scalping | 7–9 periods | Faster response, more market noise |
| Day Trading | 9–14 periods | Balance between sensitivity and smoothing |
| Swing Trading | 14 periods | Standard momentum analysis |
| Position Trading | 14–21 periods | Smoother momentum interpretation |
These are illustrative settings, not universally optimal configurations.
Shorter RSI periods generally react more quickly to price changes but can produce more frequent misleading signals.
Longer periods smooth fluctuations but may respond more slowly to changing market conditions.
Traders should evaluate settings through historical testing and realistic execution assumptions.
Momentum Measurement
RSI provides a standardized framework for comparing recent upward and downward price movements.
Overbought and Oversold Identification
It highlights market conditions where recent gains or losses have become relatively pronounced.
Divergence Detection
RSI can reveal momentum discrepancies that are not immediately obvious from price movements alone.
Multiple Timeframe Compatibility
The indicator can be applied to intraday, daily, weekly, and monthly charts.
RSI is available on widely used trading platforms, including MetaTrader 4 and MetaTrader 5.
Overbought or oversold readings can occur without a subsequent price reversal.
Strong Trend Conditions
RSI may remain above 70 or below 30 for extended periods during persistent market trends.
Lagging Calculation
RSI uses historical price data and therefore does not predict future prices independently.
News-Driven Volatility
Unexpected economic announcements, monetary policy decisions, and geopolitical developments can override technical expectations.
Parameter Sensitivity
Different lookback periods can produce substantially different momentum readings and signals.
Overreliance on a Single Indicator
RSI does not independently account for liquidity conditions, spreads, slippage, transaction costs, or broader market fundamentals.
Effective risk management remains essential regardless of the trading indicator or strategy being used.
The RSI Indicator is commonly used in Forex to evaluate currency pair momentum and identify potential trading opportunities.
For example, consider EUR/USD trading near an established resistance level.
Suppose:
This combination may suggest weakening bullish momentum.
However, a trader would still need to evaluate spread conditions, macroeconomic events, market structure, and position sizing before making a decision.
RSI can also be used when analyzing major currency pairs such as GBP/USD, USD/JPY, and AUD/USD.
RSI is frequently applied to gold (XAU/USD), equity indices, and individual stocks.
Gold prices can respond rapidly to changes in:
An RSI reading above 70 during a strong gold rally can indicate substantial upward momentum rather than an immediate selling opportunity.
Gold traders often combine RSI with support and resistance levels, volatility indicators, and macroeconomic analysis.
Stock traders use RSI to examine momentum during price trends, corrections, and consolidation periods.
For example, a stock trading above its long-term moving average while maintaining RSI readings above 50 may exhibit positive momentum characteristics.
However, earnings announcements and company-specific developments can significantly affect price behavior regardless of technical indicator readings.
RSI and Moving Average Convergence Divergence (MACD) are both momentum-related technical indicators, but they measure different aspects of market behavior.
| Feature | RSI | MACD |
|---|---|---|
| Indicator Type | Momentum oscillator | Trend-following momentum indicator |
| Calculation Basis | Average gains and losses | Relationship between exponential moving averages |
| Standard Scale | 0–100 | Unbounded |
| Main Applications | Momentum extremes and divergence | Trend momentum and signal-line crossovers |
| Traditional Reference | 70, 50, and 30 | Zero line and signal line |
Some traders combine RSI and MACD to obtain complementary information about momentum and trend conditions.
However, using multiple indicators does not eliminate false signals or guarantee profitable trades.
The Relative Strength Index provides traders with a structured method for evaluating market momentum.
Its significance comes from several practical applications:
Market Momentum Assessment
RSI helps traders distinguish between stronger and weaker recent directional price movements.
Potential Reversal Identification
Overbought, oversold, and divergence signals can highlight conditions worth investigating.
RSI provides measurable conditions that can be incorporated into discretionary or rule-based trading systems.
Technical Confirmation
Combined with price action, trend analysis, and volatility measurements, RSI may provide additional context for trading decisions.
Because of its simplicity and broad platform availability, RSI remains one of the most recognized indicators in technical analysis.
The RSI Indicator is a technical momentum oscillator that compares recent average price gains and losses. It helps traders assess market momentum and identify potentially overbought or oversold conditions.
The traditional setting is 14 periods. Shorter settings respond faster, while longer settings produce smoother readings. The appropriate configuration depends on the asset, timeframe, and trading strategy.
Not necessarily. An RSI reading below 30 indicates relatively strong recent downward momentum. Traders generally look for additional confirmation before interpreting it as a potential buying opportunity.
No. An RSI reading above 70 indicates strong recent upward momentum and potentially overbought conditions. Prices can continue rising despite an elevated RSI reading.
Yes. Some Forex scalpers use shorter RSI settings on lower timeframes. However, these configurations can produce more market noise and require careful consideration of spreads, execution costs, and volatility.
RSI measures momentum using average price gains and losses. Stochastic RSI applies the stochastic formula to RSI values, making it generally more sensitive to short-term changes in momentum.
Technical Analysis / Trading Indicators / Forex
Risk Management, Algorithmic Trading, Moving Average, MACD, Momentum Indicator, Technical Analysis, Support and Resistance, Divergence, Overbought, Oversold, Stochastic Oscillator