Why High Win Rate Signals Do Not Always Mean Better Trading Signals
Why High Win Rate Signals Do Not Always Mean Better Trading Signals
A 90% win rate sounds almost irresistible.
When traders compare signal services, claims such as “90% winning trades,” “85% accuracy,” or “only one losing signal out of ten” immediately attract attention.
It is easy to understand why.
Most people naturally assume that a system that wins more often must be better.
But in trading, that assumption can be dangerously incomplete.
A win rate tells you only one thing:
What percentage of trades closed as winners?
It does not tell you:
- How large the winning trades were
- How large the losing trades were
- How much capital was risked
- What the maximum drawdown was
- Whether stop-losses were respected
- Whether martingale was used
- Whether losing positions were averaged
- Whether the strategy has positive expectancy
- Whether the results survived different market conditions
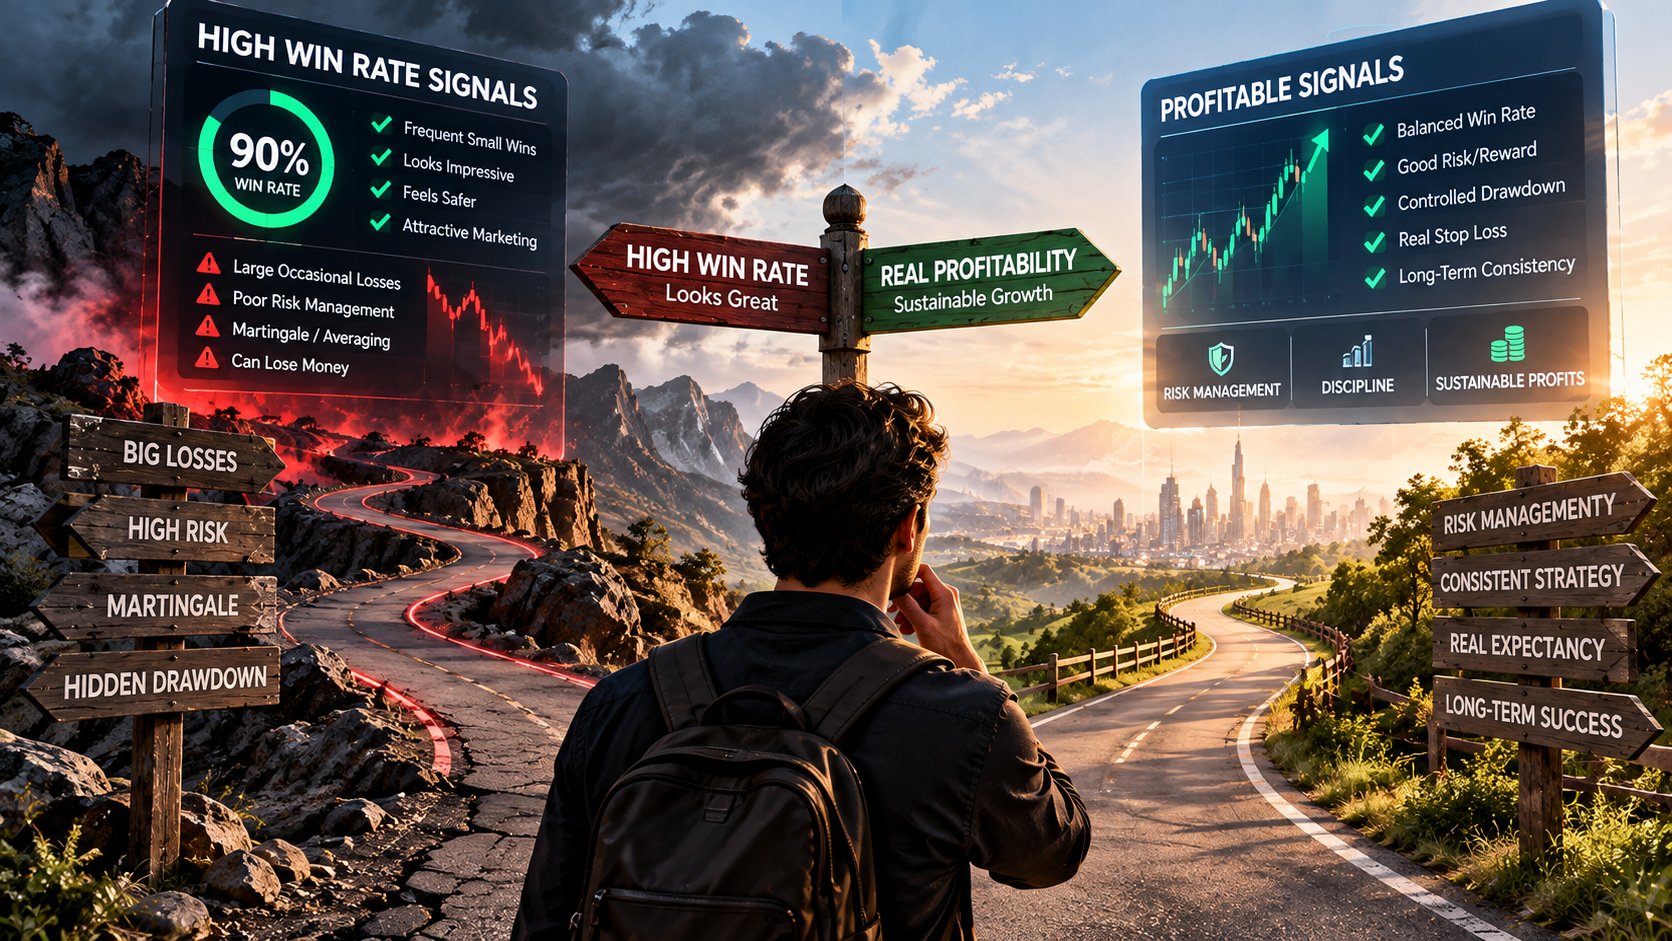
That is why high win rate signals are not automatically high-quality signals.
A service can win 90% of its trades and still lose money.
Another service can win only 45% of its trades and remain strongly profitable over the long term.
The difference lies in what happens behind the win rate.
1. Why High Win Rate Signals Are So Attractive
The attraction is not purely mathematical.
It is psychological.
Humans prefer being right.
Winning repeatedly feels reassuring. Losing feels uncomfortable.
A signal service that reports eight or nine winners out of every ten trades therefore creates a powerful impression of:
- Skill
- Accuracy
- Safety
- Predictability
- Control
But financial markets do not reward traders for feeling right.
They reward positive financial outcomes.
Suppose Trader A wins nine out of ten trades.
Each winner makes $10.
The single losing trade loses $200.
The result is:
9 × $10 = $90 profit
1 × $200 = $200 loss
Net result = -$110
The trader achieved a 90% win rate and still lost money.
Now consider Trader B.
They win only four out of ten trades.
Each winner makes $100.
Each losing trade loses $30.
The result is:
4 × $100 = $400 profit
6 × $30 = $180 loss
Net result = +$220
The second trader has only a 40% win rate, yet produces a much better financial outcome.
This simple comparison explains why win rate cannot be evaluated in isolation.
2. Why Traders Love High Win Rates
A major reason is loss aversion.
People generally dislike losses more intensely than they enjoy equivalent gains.
A system that produces frequent winning trades therefore feels psychologically easier to follow.
FINRA also emphasizes that investment decisions should consider how much risk an investor is willing and able to tolerate, rather than focusing only on potential returns.
FINRA – Know Your Risk Tolerance
A trader may therefore prefer:
- 90 small wins and a few dangerous losses
over:
- 50 controlled wins and 50 controlled losses
even if the second system produces more money.
This is where psychology and mathematics begin to conflict.
Professional traders eventually learn that they do not need to be right all the time.
They need a profitable process.
3. Win Rate vs. Real Profitability
Win rate asks:
How often does the strategy win?
Profitability asks:
How much money remains after all wins and losses are combined?
These are different questions.
Consider another example.
System A
Win Rate: 90%
Average Winner: $10
Average Loser: $150
After 10 trades:
9 winners = +$90
1 loser = -$150
Net result: -$60
System B
Win Rate: 40%
Average Winner: $100
Average Loser: $30
After 10 trades:
4 winners = +$400
6 losers = -$180
Net result: +$220
System B is wrong more often.
Yet it makes more money.
This is why professional traders focus on the financial distribution of wins and losses rather than the percentage of winning trades alone.
4. How a 90% Win Rate Can Still Lose Money
The mathematics are straightforward.
A high win rate becomes dangerous when:
Average Loss >> Average Win
Imagine a signal provider publishes ten trades.
Nine generate $20 each.
Total profit:
$180
One position is allowed to run deeply into loss and eventually closes at:
-$300
Final result:
-$120
The marketing department can still say:
“90% Win Rate.”
Technically, that statement is correct.
Financially, however, the strategy lost money.
This is one of the most important lessons when evaluating high win rate signals:
Never ask only how often the strategy wins. Ask what happens when it loses.
5. Risk-to-Reward Matters as Much as Win Rate
Win rate and risk-to-reward must be evaluated together.
Suppose a trade risks $50 to potentially make $100.
Its risk-to-reward ratio is:
1:2
A strategy with this structure does not need to win 80% or 90% of the time to potentially be profitable.
Now consider a strategy that risks $200 to make $20.
Its structure is:
10:1 risk for 1 reward
Such a strategy may require an extremely high win rate simply to survive.
Professional traders therefore evaluate:
Win Rate + Average Win + Average Loss
rather than win rate alone.
FastPip’s broader guide to trading styles also emphasizes that risk management, stop-loss rules, position sizing, and trading style need to fit together rather than being evaluated independently.
FastPip – Trading Types and Risk Management
6. Why Professional Traders Do Not Focus Only on Win Rate
Professional traders want to know the entire structure behind a strategy.
If a provider advertises a 90% win rate, they may ask:
- What is the average winner?
- What is the average loser?
- What is the maximum drawdown?
- How many trades produced this result?
- What is the expectancy?
- Are stop-losses fixed?
- Are positions averaged?
- Does position size increase after losses?
- Is martingale involved?
- Has performance remained stable across market conditions?
These questions reveal far more than the headline win rate.
A professional trader understands that the real goal is not:
“Be right as often as possible.”
The goal is:
“Generate positive long-term expectancy while controlling risk.”
7. The Psychological Trap: “I Hate Losing”
Many traders do not actually want a mathematically superior system.
They want an emotionally comfortable one.
Repeated small wins create satisfaction.
Every profitable notification reinforces the belief:
“This strategy works.”
Losses create the opposite reaction.
This can push traders toward systems designed to avoid recording losses rather than systems designed to manage them intelligently.
That distinction matters.
A losing trade that is closed quickly may represent excellent risk management.
A losing trade that remains open for weeks because the provider refuses to accept the loss may eventually become catastrophic.
Professional trading requires changing the relationship with losses.
A loss is not automatically evidence of failure.
It can simply be the cost of operating a probabilistic strategy.
8. High Win Rates Created by Removing Stop-Losses
One of the easiest ways to artificially increase a win rate is to avoid closing losing trades.
Imagine a provider buys EURUSD.
The market moves against the position.
Instead of closing at the predefined invalidation point, the provider waits.
If the market eventually returns, the trade may close for a small profit.
The statistics now show another winner.
Repeat this behavior hundreds of times and the reported win rate may become extremely impressive.
But what happens when the market does not return?
The open loss keeps growing.
This is why a professional service should have a clear answer to:
“Where is the trade proven wrong?”
Retail forex can involve significant risk, especially when leverage magnifies market movements, which is one reason disciplined risk control matters.
A high win rate achieved by refusing to accept losses is not necessarily a sign of skill.
It may be a sign of hidden tail risk.
9. Martingale: The Classic High Win Rate Trap
Martingale provides one of the clearest examples of why high win rate signals can be misleading.
The basic idea is simple.
A trade loses.
Instead of accepting the loss, the next position is increased.
If that position also loses, exposure increases again.
The objective is to eventually recover previous losses when the market reverses.
This can produce an impressive sequence of winning cycles.
A system might report:
- 90% win rate
- 95% win rate
- 98% win rate
For long periods, everything can appear stable.
But the risk is asymmetric.
As losing positions accumulate, exposure can grow rapidly.
Eventually a prolonged market move can create a loss large enough to wipe out months—or even years—of smaller profits.
This is why professional traders become more cautious, not less cautious, when they see unusually high win rates.
They want to understand how those wins were produced.
10. Averaging Down Can Create the Illusion of Permanent Success
Averaging down can produce a similar effect.
Suppose a trader buys gold at 3,500.
Price falls to 3,480.
Instead of accepting the original trade as wrong, another position is added.
Price falls to 3,460.
Another position is added.
The average entry price improves.
Now the market needs only a partial recovery for the entire basket to move toward breakeven or profit.
This can make a strategy look extremely accurate.
Trades that initially went wrong eventually appear in the statistics as winners.
But there is a hidden cost:
Exposure increases while the original idea is moving against the trader.
Averaging itself is not automatically irrational in every possible strategy.
The critical questions are:
- Is it predefined?
- Is total risk capped?
- Is position size controlled?
- Is there an ultimate invalidation level?
- Can the account survive a sustained trend?
Without these controls, averaging can convert frequent small wins into occasional catastrophic losses.
11. Is a Low Win Rate Always Bad?
No.
A relatively low win rate can be part of an excellent strategy.
Trend-following strategies are a good example.
A trader may take several small losses while searching for a major trend.
When a strong trend finally appears, one large winning trade can compensate for several previous losses.
Consider:
Win Rate: 40%
Average Winner: $300
Average Loser: $100
Across ten trades:
4 × $300 = $1,200 profit
6 × $100 = $600 loss
Net result:
+$600
The strategy loses more often than it wins.
But financially, it works.
This is why the statement:
“Only 40% win rate”
has almost no meaning without additional context.
12. Why Some Successful Traders Win Less Than 50% of the Time
Professional trading is often built around asymmetry.
The trader tries to:
- Keep losses controlled
- Avoid catastrophic exposure
- Allow strong trades to run
- Capture larger market moves
- Maintain consistent position sizing
The objective is not necessarily to maximize winning frequency.
It is to maximize the quality of the overall distribution of outcomes.
A trader can therefore lose six times, win four times, and still have a profitable period.
FastPip has discussed the same problem in the context of scalping: extremely high win rates can create false confidence when they are accompanied by weak stop discipline, poor risk-to-reward, averaging behavior, or large tail risk.
FastPip – Scalping Trading Risks
13. Expectancy Is More Important Than Win Rate
One of the most useful metrics for understanding a trading strategy is expectancy.
Expectancy estimates the average amount a strategy can be expected to make or lose per trade over a sufficiently large sample.
A simplified formula is:
Expectancy = (Win Rate × Average Win) − (Loss Rate × Average Loss)
Consider a strategy with:
Win Rate: 40%
Average Win: $300
Loss Rate: 60%
Average Loss: $100
The expectancy is:
(0.40 × $300) − (0.60 × $100)
$120 − $60 = +$60
That means the strategy generates an average expected value of approximately +$60 per trade under those assumptions.
Now consider:
Win Rate: 90%
Average Win: $10
Loss Rate: 10%
Average Loss: $150
Expectancy:
(0.90 × $10) − (0.10 × $150)
$9 − $15 = -$6
The second strategy wins 90% of the time.
Yet its expectancy is negative.
This is why expectancy gives a much deeper picture than win rate alone.
14. Sample Size Determines Whether Win Rate Is Meaningful
A provider says:
“Our win rate is 90%.”
The next question should be:
Across how many trades?
90% across 10 trades?
That means nine winners and one loser.
The statistical evidence is limited.
90% across 2,000 trades?
That is far more informative.
Sample size matters because short sequences can be heavily influenced by randomness.
A few favorable trades can make an ordinary system look exceptional.
When evaluating high win rate signals, check:
- Number of trades
- Length of history
- Number of market cycles covered
- Instruments traded
- Trading conditions
- Whether all signals were included
Never evaluate the percentage without evaluating the denominator.
15. How High Win Rates Are Used in Marketing
Win rate is an ideal marketing statistic because it is easy to understand.
“95% accuracy” requires no financial education.
Users instantly interpret the statement as:
“I have a 95% chance of making money.”
But that interpretation can be wrong.
A marketing claim may omit:
- Average loss
- Maximum drawdown
- Floating losses
- Removed trades
- Breakeven trades
- Averaged positions
- Changes to stop-losses
- Position-size escalation
The important question is therefore not whether the advertised percentage is attractive.
It is whether the methodology behind the number is transparent.
16. Real Win Rate vs. Marketing Win Rate
A genuine win rate should ideally include all relevant completed trades according to a consistent methodology.
Problems emerge when statistics selectively classify outcomes.
For example:
A provider might:
- Highlight only selected periods
- Exclude certain losing signals
- Count breakeven trades as wins
- Avoid closing deeply losing positions
- Present multiple entries as one successful idea
- Report only trades that reached a specific target
None of these practices can be understood from the headline percentage alone.
Before trusting high win rate signals, ask:
How exactly is the win rate calculated?
Transparency about methodology is just as important as the number itself.
17. Drawdown Can Reveal What Win Rate Hides
Imagine two services.
Both report an 85% win rate.
Service A
Maximum Drawdown: 8%
Service B
Maximum Drawdown: 55%
The win-rate statistics look identical.
The risk profiles are completely different.
Drawdown measures the decline from a previous account peak and can expose how severely a strategy has struggled during difficult periods.
A system can generate many winning trades while still experiencing dangerous drawdowns.
That is why professional evaluation should examine:
Win Rate + Drawdown + Risk-to-Reward + Expectancy
rather than Win Rate alone.
FINRA similarly stresses that higher potential returns generally come with greater risk and that investors should consider their ability to tolerate losses.
18. Why Consistency Matters More Than a Headline Win Rate
Suppose a provider reports:
January: 95% win rate
February: 92%
March: 90%
Impressive.
But what happens next?
April: massive drawdown
May: martingale recovery
June: strategy changes
July: performance history disappears
Short-term accuracy does not prove long-term stability.
A professional service should be evaluated across:
- Trending markets
- Ranging markets
- High volatility
- Low volatility
- Major news
- Changing liquidity environments
- Winning periods
- Losing periods
Consistency does not mean the strategy must make money every month.
That would be unrealistic.
It means the risk framework and decision-making process remain disciplined when market conditions change.
19. Metrics More Important Than Win Rate
When analyzing a signal provider, these metrics may tell you more than the headline win rate.
Risk-to-Reward Ratio
How much does the strategy usually risk to make one unit of profit?
Expectancy
How much value does an average trade create over the long run?
Maximum Drawdown
How severe was the largest decline from a previous account peak?
Average Win
How much does a typical winning trade make?
Average Loss
How much does a typical losing trade lose?
Sample Size
How many trades support the statistics?
Long-Term Consistency
Has performance survived multiple market environments?
Stop-Loss Discipline
Does the strategy accept invalidation or continuously move stops?
Transparency
Are losses reported with the same honesty as wins?
Position-Sizing Discipline
Does risk remain stable, or does exposure increase aggressively after losses?
Together, these metrics create a much more realistic view of strategy quality.
20. 10-Point Checklist for Evaluating High Win Rate Signals
Before subscribing to a provider advertising an exceptionally high win rate, use this checklist.
1. How Many Trades Produced the Win Rate?
An 85% win rate across 20 trades is not equivalent to the same percentage across 2,000 trades.
2. What Time Period Does the Statistic Cover?
One month is different from several years.
3. Are All Trades Included?
Check whether losing trades, cancelled trades, and breakeven outcomes are treated transparently.
4. What Is the Risk-to-Reward Ratio?
A high win rate with very large average losses may be dangerous.
5. What Is the Maximum Drawdown?
Determine how much capital the strategy has lost from peak to trough.
6. Are Real Stop-Losses Used?
Be cautious when stops are absent or repeatedly moved farther away.
7. Is Martingale or Aggressive Averaging Used?
A very high win rate can be created by continuously increasing exposure.
8. What Is the Strategy’s Expectancy?
Positive expectancy matters more than the emotional comfort of frequent wins.
9. How Are Losing Trades Managed?
Does the provider accept small losses or allow them to become large?
10. Would the Strategy Still Look Attractive Without the Win Rate?
This may be the most useful question.
Imagine removing the phrase:
“90% Win Rate.”
Would you still trust the strategy based on:
- Risk control
- Drawdown
- Transparency
- Expectancy
- Long-term performance
- Trade management
- Position sizing
If not, the win rate may be doing more marketing work than the strategy itself.
Keep Your Own Performance Records
Never rely entirely on a provider’s statistics.
Record the trades you actually receive and execute.
A trading journal can include:
- Signal time
- Entry
- Stop-loss
- Target
- Position size
- Result
- Risk-to-reward
- Changes to the stop
- Partial exits
- Maximum adverse movement
- Final profit or loss
FastPip’s Trading Journal guide explains how systematic recording helps traders review strategy performance, execution quality, decisions, and behavioral patterns over time.
FastPip – Trading Journal Writing Guide
Your own records can reveal whether the advertised statistics match the experience of a real user.
Conclusion: Good Signals Are Not Defined by Win Rate
A 90%, 95%, or even 98% win rate can look extraordinary.
But the number does not tell the entire story.
High win rate signals can still be dangerous when their performance is created through:
- Oversized losses
- Poor risk-to-reward
- No stop-loss
- Martingale
- Aggressive averaging
- Excessive leverage
- Hidden floating losses
- Selective reporting
Likewise, a signal service with a 40% or 50% win rate can potentially be highly effective when it combines:
- Small controlled losses
- Larger winners
- Positive expectancy
- Reasonable drawdown
- Consistent position sizing
- Transparent reporting
- Long-term discipline
Professional traders understand that trading is not a competition to see who can be right most often.
The objective is to protect capital and create positive long-term returns.
So when a signal provider advertises:
“90% Win Rate”
do not stop there.
Ask:
How much does a winner make?
How much does a loser cost?
What is the maximum drawdown?
What is the expectancy?
Are stop-losses real?
Is martingale involved?
How many trades produced the statistic?
Are all losses reported?
Those questions reveal far more about a trading system than a headline percentage ever can.
A good signal is not simply one that wins often.
A good signal is part of a transparent, disciplined, risk-controlled system capable of surviving both winning and losing periods.
That is the difference between an attractive statistic and sustainable trading.
Frequently Asked Questions
Are high win rate signals always better?
No. A high win rate does not show the size of the wins, the size of the losses, drawdown, risk-to-reward, or expectancy. A lower-win-rate strategy can outperform a high-win-rate strategy if its winners are larger and its losses are controlled.
Can a 90% win rate strategy lose money?
Yes. If the 10% of losing trades are significantly larger than the 90% of winning trades, the strategy can have negative overall profitability.
What matters more than win rate?
Important metrics include risk-to-reward ratio, expectancy, maximum drawdown, average win, average loss, sample size, stop-loss discipline, and long-term consistency.
What is expectancy in trading?
Expectancy estimates how much a strategy is expected to make or lose on average per trade based on its win rate, average win, loss rate, and average loss.
Is a 40% win rate bad?
Not necessarily. A 40% win rate can be highly profitable when average winning trades are substantially larger than average losing trades.
Why do some signal providers advertise extremely high win rates?
Win rate is simple to understand and psychologically attractive, making it a powerful marketing metric. Traders should examine how the percentage was calculated and what risks were required to achieve it.
Can martingale create a high win rate?
Yes. Martingale-style systems can create long sequences of winning cycles because exposure increases after losses. The trade-off can be severe tail risk when the market continues moving against the strategy.
Can removing stop-losses increase win rate?
It can increase the reported win rate because losing positions are allowed more time to recover. However, unresolved losses can grow significantly and create large drawdowns.
Why should I check drawdown alongside win rate?
Win rate shows how often trades won. Drawdown helps show how much account value was lost during difficult periods. Together they provide a much better view of risk.
How many trades are needed before a win rate is meaningful?
There is no single universal number. In general, a larger and more representative sample across different market conditions provides stronger evidence than a small number of trades.
What should I ask before subscribing to high win rate signals?
Ask about average wins and losses, risk-to-reward, maximum drawdown, expectancy, sample size, stop-loss policy, martingale or averaging methods, position sizing, performance history, and how losing trades are reported.