Why Trading Signal Strategies Stop Working
Why Trading Signal Strategies Stop Working
A trading strategy can perform extremely well for months—or even years—and then gradually begin to lose its edge.
Win Rate falls.
Drawdown increases.
False signals become more frequent.
Trades that once moved quickly toward their targets begin to stall or reverse.
This raises an important question:
Why do trading strategies stop working?
The answer is closely connected to signal strategy lifespan.
No trading strategy operates in a permanently stable environment.
Markets constantly change because of:
- Volatility
- Liquidity
- Interest rates
- Economic news
- Market participants
- Algorithmic trading
- Investor behavior
- Trading costs
- Market regimes
Every strategy is built on assumptions about how markets behave.
When those assumptions stop matching reality, performance can deteriorate.
This does not necessarily mean the original strategy was bad.
It may simply mean:
The market it was designed for no longer exists in the same form.
What Is Signal Strategy Lifespan?
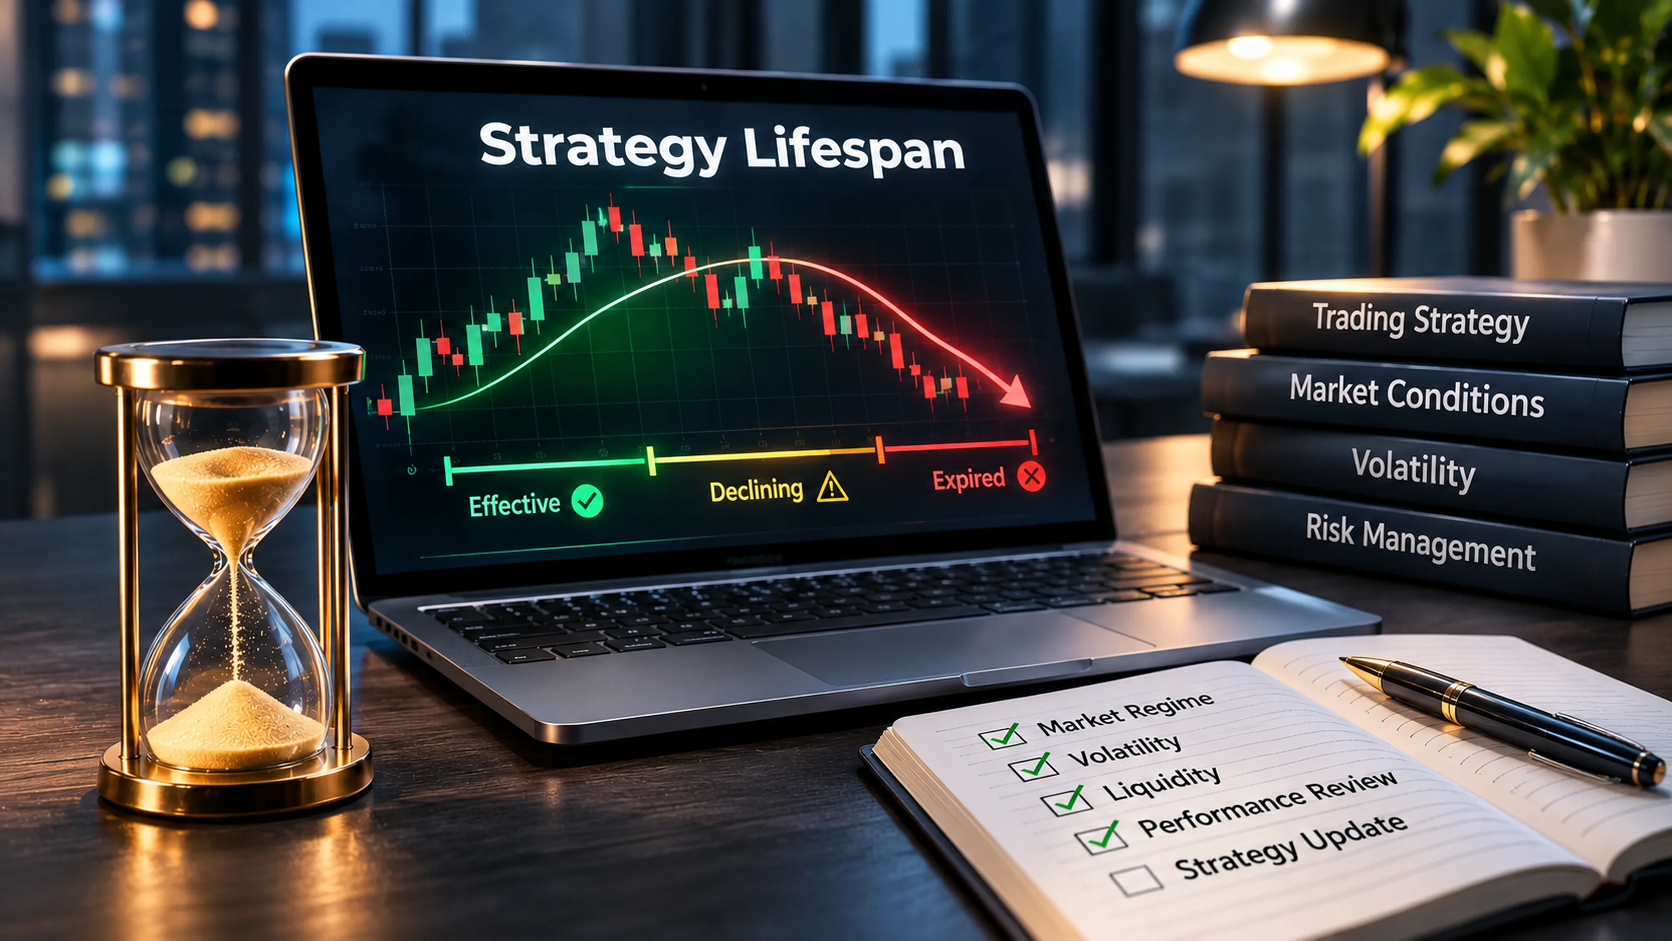
Signal strategy lifespan refers to the period during which a trading strategy maintains a meaningful statistical advantage under real market conditions.
That period is not fixed.
A strategy might remain effective for:
- Several months
- Several years
- Only one market cycle
depending on its design and the environment in which it operates.
The important principle is:
Strategies are conditional.
They work because certain market behaviors exist.
If those behaviors disappear, the strategy’s edge can weaken.
Does a Signal Strategy Have a Fixed Lifespan?
No.
There is no universal rule such as:
“A strategy remains valid for three years.”
Its lifespan depends on the market environment.
Suppose a Trend-Following strategy was developed during a period of persistent directional movement.
Its logic may assume:
- Breakouts continue
- Momentum persists
- Trends last long enough to generate favorable Risk/Reward
If the market later becomes highly range-bound, those assumptions may no longer hold.
The strategy has not necessarily become mathematically wrong.
It is operating in the wrong environment.
Market Regime Is One of the Biggest Factors
Financial markets move through different behavioral states or market regimes.
Common regimes include:
- Trending
- Range-bound
- High volatility
- Low volatility
- Risk-on
- Risk-off
A strategy that performs well in one regime may struggle badly in another.
This is one of the most important concepts for understanding signal strategy lifespan.
Trend-Following Example
A Trend-Following strategy assumes price movement will persist.
In a strong trend it may produce:
- Cleaner breakouts
- Longer winners
- Stronger momentum
But when the market becomes range-bound, the same strategy can experience:
- False breakouts
- Repeated Stop Losses
- Lower expectancy
The strategy did not suddenly forget how to trade.
Its environment changed.
Market Regime Shifts Can Break Old Assumptions
A Market Regime Shift occurs when the underlying behavior of a market changes materially.
For example:
Low Volatility → High Volatility
Trending → Range
Risk-On → Risk-Off
Loose Monetary Policy → Tight Monetary Policy
These shifts can change:
- Price behavior
- Correlations
- Liquidity
- Volatility
- Average trade duration
- Breakout reliability
A strategy calibrated to the old regime may become much less effective.
Regime Changes Are Often Gradual
One of the difficulties is that market-regime shifts are rarely announced clearly.
Performance may deteriorate gradually.
For example:
Historical Win Rate: 64%
Then:
61%
58%
54%
49%
At the same time:
Drawdown rises.
Average winner falls.
False signals increase.
This gradual deterioration is often easier to ignore than a sudden collapse.
Trend Shifts Can Reduce Strategy Lifespan
Strategies built around directional movement are particularly sensitive to Trend Shifts.
Suppose a system repeatedly produces BUY signals during an established uptrend.
As long as:
- Higher highs continue
- Higher lows remain intact
- Momentum persists
the approach may work well.
But eventually the trend weakens.
Market structure changes.
The same BUY signals can now become:
- Late
- Lower-quality
- Loss-making
A Trend Shift therefore changes the statistical environment behind the signals.
Range Strategies Have the Opposite Problem
Range-trading systems normally assume:
Price will revert toward the middle of a defined range.
Typical logic:
Buy near support.
Sell near resistance.
This can work very well when markets remain balanced.
But when a powerful trend begins, the assumption of mean reversion becomes dangerous.
Support stops acting like support.
Resistance stops acting like resistance.
The strategy can repeatedly trade against the developing trend.
What Happens to Range Strategies in Trending Markets?
Imagine a range strategy repeatedly sells resistance.
During a stable range:
Resistance → Sell → Price returns lower.
But after a breakout:
Resistance breaks → Strategy sells → Market continues higher.
The same logic that previously generated profits now creates losses.
This demonstrates a fundamental principle:
Strategy quality cannot be separated from market conditions.
What Happens to Trend Strategies in Range Markets?
Trend-Following strategies suffer from the opposite environment.
They may repeatedly buy breakouts.
But in a range:
Breakout → Reversal
Breakout → Reversal
Breakout → Reversal
These False Breakouts can create repeated small losses.
The strategy’s Win Rate may decline even though the entry rules remain unchanged.
Volatility Can Change a Strategy’s Edge
Volatility is another major factor affecting signal strategy lifespan.
Many strategies are built around an implicit volatility assumption.
For example:
Typical Stop Loss:
50 points
Typical Target:
100 points
If market volatility suddenly doubles, a 50-point Stop Loss may become too narrow.
Normal market noise can trigger it before the expected movement develops.
Low Volatility Can Also Cause Problems
Low volatility creates a different issue.
A strategy may expect:
Large directional moves.
But the market produces:
Small, slow fluctuations.
Targets become harder to reach.
Trades remain open longer.
Transaction costs consume a larger portion of expected profit.
So both excessive and insufficient volatility can reduce strategy performance.
Volatility Changes the Meaning of Stop Losses
A Stop Loss should be considered relative to current market behavior.
Imagine:
Historical daily movement:
100 points
Strategy Stop:
50 points
Then average market movement increases to:
250 points.
The same Stop Loss now sits much closer to normal market noise.
The rules have not changed.
The environment has.
Liquidity Can Shorten Signal Strategy Lifespan
Liquidity affects how easily positions can be opened or closed.
When liquidity is strong:
- Spreads may be tighter
- Execution may be smoother
- Slippage may be lower
When liquidity deteriorates:
- Spreads widen
- Slippage increases
- Price moves become more irregular
A strategy built around very precise entries may perform significantly worse.
Why Liquidity Matters for Short-Term Strategies
Suppose a scalping strategy expects:
Average profit:
5 pips
Historical execution cost:
1 pip
The strategy still has room to generate profit.
But imagine total spread and execution cost increases to:
3 pips.
Now 60% of the expected gross profit may disappear into transaction costs.
The analytical signal can remain accurate.
The economic strategy may no longer be viable.
FastPip’s Trading Types guide explains why spreads, commissions and execution quality are especially important for short-term styles such as Scalping.
Spread and Slippage Can Erode an Edge
A strategy does not trade on a theoretical chart.
It trades in a real market.
Real execution includes:
- Spread
- Commission
- Slippage
- Latency
Suppose a backtest produces:
Expected value per trade:
+1.5 pips
But average real-world trading friction becomes:
2 pips
The strategy may be statistically profitable before costs and unprofitable after costs.
This is why live performance can deteriorate even when the analytical logic appears unchanged.
Economic News Can Create Temporary Regime Changes
Major economic announcements can produce market conditions completely different from normal trading.
Examples include:
- Interest-rate decisions
- Inflation releases
- Employment reports
- Central-bank announcements
- Unexpected geopolitical events
During these periods:
- Volatility can spike
- Spread can widen
- Liquidity can disappear
- Correlations can change
A strategy designed for normal conditions may temporarily lose its edge.
One News Event Does Not Necessarily Kill a Strategy
This distinction is important.
Temporary underperformance during an unusual event does not automatically mean the strategy has permanently expired.
The key question is:
Does performance recover when normal market conditions return?
If yes, the strategy may simply require a market-condition filter.
If no, there may be a deeper problem.
Why Backtests Can Fail in Live Markets
A strong historical backtest is useful.
It is not proof that the strategy will continue working.
Backtests use historical conditions.
Live trading occurs in future conditions.
Those conditions may differ.
Backtests Can Miss Real Execution
Historical tests may underestimate:
- Spread
- Slippage
- Latency
- Partial fills
- Liquidity problems
A strategy with a small statistical edge can lose that edge once realistic execution costs are included.
Overfitting Is a Major Threat
One of the most important causes of strategy failure is overfitting.
Overfitting occurs when a strategy is optimized so closely to historical data that it learns:
historical noise
instead of:
repeatable market behavior.
For example, developers may test hundreds of:
- Indicator settings
- Stop Loss values
- Take Profit values
- Entry filters
until they find the combination producing the best historical result.
That result may look extraordinary.
But it may simply be the configuration that best fits past randomness.
Excellent Backtests Can Produce Weak Live Results
Imagine two strategies.
Strategy A
Backtest:
+450%
Live:
+12%
Strategy B
Backtest:
+130%
Live:
+85%
Which strategy was more robust?
Probably Strategy B.
The most impressive historical curve is not always the most reliable model.
Out-of-Sample Testing Matters
One way to reduce overfitting risk is separating data into:
Development Data
and:
Out-of-Sample Data
The strategy is designed on one period.
Then tested on data it has never seen.
If performance immediately collapses, the strategy may have been fitted too closely to historical noise.
Forward Testing Is Even More Important
After backtesting, a strategy should ideally be tested on live or forward data.
Forward testing exposes the model to:
- New prices
- Real timing
- Real spread
- Real volatility
- Live execution
This helps determine whether the historical edge survives.
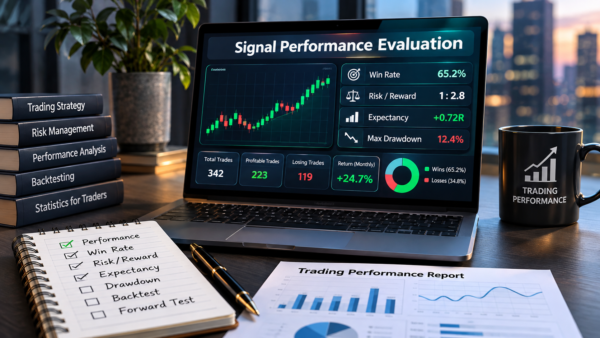
FastPip’s Signal Provider Performance Evaluation article explains why combining Backtesting and Forward Testing creates a stronger evaluation framework than relying on historical results alone.
FastPip – Signal Provider Performance Evaluation
Changing Trader Behavior Can Erode Strategies
Markets are adaptive.
They are influenced by:
- Humans
- Institutions
- Algorithms
If a profitable pattern becomes widely known, participants may change their behavior around it.
This can reduce the pattern’s effectiveness.
Popular Strategies Can Become Crowded
Imagine a technical setup becomes extremely popular.
Thousands of traders begin using it.
Other participants learn where:
- Entries occur
- Stops cluster
- Breakouts are expected
The market’s response to the pattern may change.
This is one way an edge can gradually decay.
Algorithms Accelerate Market Adaptation
Algorithmic trading has increased the speed at which markets respond to information.
Modern systems can:
- Detect patterns
- Process data
- Submit orders
far faster than human traders.
This can reduce the lifespan of simple, easily detectable inefficiencies.
Algorithms Can Change the Shape of Price Action
Algorithmic systems do not merely observe markets.
Their orders become part of the market.
As automated participation increases, characteristics such as:
- Short-term volatility
- Liquidity
- Reaction speed
- Order-book behavior
can change.
Strategies developed in an earlier market structure may therefore need reassessment.
Does This Mean Simple Strategies Cannot Work?
No.
Simple does not automatically mean bad.
A clear strategy can be highly effective.
The problem is assuming that simplicity guarantees permanence.
Simple strategies may have fewer ways to adapt when market behavior changes.
For example:
Buy every moving-average crossover
contains very little contextual information.
Adding filters for:
- Trend strength
- Volatility
- Liquidity
- Session
may improve robustness.
More Complex Does Not Automatically Mean Better
The opposite mistake is adding endless rules.
More complexity can increase:
Overfitting risk.
A strategy with 30 parameters may perfectly explain the past and completely fail in the future.
The objective should be:
Robustness
not:
Maximum complexity.
Competition Can Reduce Strategy Lifespan
Markets are competitive.
Profitable opportunities attract participants.
As more capital attempts to exploit the same inefficiency:
- Prices adjust faster
- Opportunities become smaller
- Execution becomes harder
The original edge can decline.
Information Travels Faster Today
Modern traders have access to:
- Real-time news
- Advanced charting
- Alternative data
- Algorithms
- AI tools
- Social media
Market information is processed rapidly.
This can reduce the lifespan of simple informational advantages.
Market Cycles Also Matter
Financial markets move through broad cycles.
These may include:
- Expansion
- Contraction
- High inflation
- Low inflation
- Tight monetary policy
- Loose monetary policy
A strategy optimized during one macro environment may struggle in another.
Correlations Can Change Across Cycles
Strategies may assume historical relationships between assets.
For example:
Currency A and Commodity B may historically move together.
Then economic conditions change.
The correlation weakens.
A strategy based on the old relationship can deteriorate even though its internal rules remain unchanged.
Signal Strategy Lifespan Is About Edge Decay
One useful way to understand the concept is through edge decay.
A trading edge exists when a strategy has positive expected value after costs.
For example:
Expected gain:
+0.4R per trade
Over time:
+0.3R
+0.2R
+0.1R
0R
-0.1R
The strategy did not necessarily fail overnight.
Its edge decayed.
How Can You Detect Strategy Decay?
Several metrics can provide early warnings.
Monitor:
- Win Rate
- Expectancy
- Profit Factor
- Average Winner
- Average Loser
- Maximum Drawdown
- Consecutive Losses
- Execution costs
Do not rely on one metric alone.
Falling Win Rate Can Be an Early Warning
Suppose long-term Win Rate is:
62%
Recent rolling results show:
58%
55%
51%
47%
This deserves investigation.
But it does not automatically prove strategy expiration.
Random variation also exists.
You need a statistically meaningful sample.
Rising Drawdown Is Another Warning
Suppose historical Maximum Drawdown was:
12%
Recent Drawdown reaches:
24%
Ask:
- Did risk increase?
- Did volatility change?
- Did market regime change?
- Is execution worse?
A large deviation from historical behavior deserves attention.
Expectancy Is Particularly Useful
Expectancy combines:
- Win Rate
- Average Win
- Average Loss
This makes it useful for detecting gradual performance deterioration.
A falling Win Rate may be harmless if average winners increase.
But falling expectancy suggests the overall edge is weakening.
Monitor Live vs. Backtest Performance
A useful comparison is:
Historical Expectation vs. Live Reality
Suppose the backtest suggests:
Win Rate: 60%
Profit Factor: 1.8
Max Drawdown: 10%
Live results:
Win Rate: 49%
Profit Factor: 1.1
Drawdown: 22%
That gap needs investigation.
Do Not Hide Deterioration With Selective Statistics
Strategy decay can be difficult to detect if only winning trades are examined.
Complete data matters.
FastPip’s article on Fake Trading Signal Statistics explains how selective reporting, missing losses and incomplete samples can make weak performance appear significantly stronger.
FastPip – Fake Trading Signal Statistics
Signal Strategy Lifespan vs. Trading Signal Expiration
These concepts sound similar but are different.
Trading Signal Expiration
Concerns one individual trade signal.
Example:
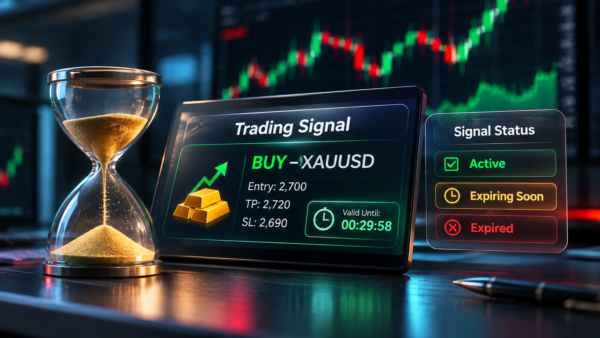
A Gold BUY signal is no longer executable after price moves too far.
Signal Strategy Lifespan
Concerns the entire system that generates signals.
Example:
A breakout strategy becomes consistently ineffective in a new market regime.
FastPip explains individual signal validity separately here:
FastPip – Trading Signal Expiration
This distinction helps build a more complete signal-evaluation framework.
Can an Expired Strategy Recover?
Sometimes.
A strategy may underperform because the market temporarily entered an unfavorable regime.
When favorable conditions return, the strategy may recover.
For example:
Trend strategy → struggles in range → works again when trend returns.
This means temporary weakness is not always permanent expiration.
When Should a Strategy Be Modified?
Modification may make sense when deterioration has a clearly identifiable cause.
For example:
If volatility doubled, consider:
- Volatility-adjusted Stop Losses
- Dynamic position sizing
If execution costs increased:
- Reduce trading frequency
- Increase minimum expected edge
If market regime changed:
- Add regime filters
When Modification Becomes Dangerous
Constantly modifying a strategy after every losing period can create overfitting.
The trader begins chasing recent performance.
Loss → Change parameter
Another loss → Add filter
Another loss → Change entry
Soon the strategy is optimized around recent noise rather than a robust principle.
Changes should be supported by data.
Can an Expired Strategy Be Saved?
Sometimes.
The first step is diagnosis.
Ask:
Did the Market Regime Change?
If yes, a market-condition filter may help.
Did Trading Costs Increase?
Execution assumptions may need updating.
Did Volatility Change?
Stops and targets may need adaptation.
Was the Strategy Overfit?
A redesign may be necessary.
Has the Underlying Edge Disappeared?
Then retirement may be the better decision.
Do Not Become Emotionally Attached to a Strategy
A strategy may have made excellent money in the past.
That does not mean it deserves permanent loyalty.
A trader should ask:
If I discovered this strategy today with its current performance data, would I still use it?
If the answer is no, nostalgia should not determine the decision.
Strategy Adaptation vs. Strategy Replacement
There are generally three choices when performance deteriorates:
Continue
When deterioration remains within expected statistical variation.
Adapt
When the core edge appears intact but environmental parameters changed.
Replace
When the underlying edge appears structurally broken.
These decisions should be data-driven.
How Professional Traders Monitor Signal Strategy Lifespan
A structured monitoring process can include:
Rolling Performance Windows
Evaluate the most recent:
- 50 trades
- 100 trades
- 200 trades
and compare them with long-term history.
Regime Analysis
Separate performance during:
- Trends
- Ranges
- High volatility
- Low volatility
Execution Analysis
Measure:
- Spread
- Slippage
- Fill quality
Risk Analysis
Track:
- Drawdown
- Consecutive losses
- Risk-adjusted return
This provides a much better view than simply asking:
“Is the strategy still profitable?”
Strategy Performance by Market Regime
A professional report might look like this:
| Market Regime | Win Rate | Expectancy | Result |
|---|---|---|---|
| Strong Trend | 68% | +0.9R | Excellent |
| Weak Trend | 58% | +0.4R | Positive |
| Range | 39% | -0.2R | Weak |
| High Volatility | 48% | +0.1R | Marginal |
Now the strategy becomes easier to understand.
The conclusion is not:
“The strategy is good.”
It is:
“The strategy is good under specific conditions.”
Why This Is Better Than One Headline Win Rate
Suppose the provider says:
Overall Win Rate: 60%
That hides the fact that performance may vary dramatically across regimes.
Market-condition analysis gives a much deeper understanding of the edge.
A Professional Signal Strategy Lifespan Checklist
Use this checklist when reviewing a strategy.
1. Has Win Rate Declined?
Compare recent and historical samples.
2. Has Expectancy Changed?
This is more important than Win Rate alone.
3. Has Maximum Drawdown Increased?
Look for unusual deterioration.
4. Has Market Regime Changed?
Trend, range or volatility conditions may have shifted.
5. Has Volatility Changed?
Old Stop Loss assumptions may no longer work.
6. Has Liquidity Changed?
Execution quality matters.
7. Have Spread and Slippage Increased?
Trading costs can destroy a small edge.
8. Does Live Performance Match Backtesting?
Large divergence needs investigation.
9. Was the Strategy Overfit?
Excellent historical performance may not generalize.
10. Has the Strategy Been Tested Out of Sample?
Independent data provides stronger evidence.
11. Does Performance Vary by Market Condition?
Identify where the system actually works.
12. Has the Strategy Become Too Crowded?
Popular edges can weaken.
13. Have Market Participants Changed?
Algorithms and institutions can alter behavior.
14. Are Recent Losses Statistically Normal?
Do not confuse normal Drawdown with structural failure.
15. Would You Adopt This Strategy Today?
Evaluate it without emotional attachment.
Why No Strategy Works Forever
The idea of a permanently profitable trading strategy is attractive.
But markets do not remain permanently unchanged.
A strategy is built around assumptions such as:
- How prices trend
- How volatility behaves
- How traders react
- How liquid the market is
- How expensive execution is
Those assumptions evolve.
Therefore, the strategy must either:
Adapt
or eventually risk becoming obsolete.
The Goal Is Not a Permanent Strategy
A more realistic objective is:
A robust strategy + continuous monitoring + controlled adaptation
This is fundamentally different from constantly changing rules.
Professional adaptation should be based on:
- Data
- Statistical evidence
- Market regimes
- Risk metrics
not emotion.
Conclusion: Understanding Signal Strategy Lifespan
Signal strategy lifespan is not determined by a fixed number of weeks, months or years.
It is determined by whether the market conditions supporting the strategy’s edge still exist.
A strategy can lose effectiveness because of:
- Market Regime Shifts
- Trend changes
- Volatility changes
- Liquidity changes
- Economic news
- Rising spread and Slippage
- Algorithmic trading
- Increased competition
- Changing trader behavior
- Overfitting
- Changes in market cycles
The most important lesson is:
A strategy should never be evaluated independently from its environment.
A Trend-Following system that fails during a range may not be broken.
A range strategy that fails during a strong trend may not be broken.
But repeatedly applying either strategy in the wrong environment can create substantial losses.
The professional approach is therefore to monitor:
Performance + Risk + Market Regime + Execution
over time.
When performance changes, do not immediately assume:
“The strategy is dead.”
First ask:
“Did the strategy change—or did the market change?”
Sometimes the strategy needs adjustment.
Sometimes it needs to be temporarily disabled.
And sometimes the underlying edge has genuinely disappeared.
The ability to distinguish between these situations is a major part of professional strategy management.
Frequently Asked Questions
What is signal strategy lifespan?
Signal strategy lifespan is the period during which a trading strategy maintains a meaningful statistical edge under real market conditions.
Do trading strategies eventually stop working?
Some do. Others temporarily underperform during unfavorable market regimes and later recover.
Why does market regime affect signal strategies?
Different strategies rely on different market behaviors. Trend strategies usually perform better in directional markets, while range strategies depend on mean-reverting conditions.
What is a Market Regime Shift?
A Market Regime Shift is a meaningful change in market behavior, such as moving from low volatility to high volatility or from trending to range-bound conditions.
Can volatility make a trading strategy stop working?
Yes. Changes in volatility can affect Stop Losses, targets, noise, trade duration and signal accuracy.
Does liquidity affect strategy performance?
Yes. Lower liquidity can increase Spread, Slippage and irregular price movements, reducing execution quality.
Can spread and slippage destroy a profitable strategy?
Yes. If the strategy has a small statistical edge, increased transaction costs can eliminate profitability.
Why do backtested strategies fail live?
Possible reasons include Overfitting, unrealistic execution assumptions, Slippage, Spread, regime changes and structural differences between historical and future markets.
What is Overfitting?
Overfitting occurs when a strategy is optimized too closely to historical data and captures noise rather than a repeatable market edge.
How can I identify strategy decay?
Monitor changes in Win Rate, Expectancy, Profit Factor, Drawdown, Average Win/Loss and live-vs-backtest performance.
Does a lower Win Rate mean the strategy is dead?
Not necessarily. Short-term statistical variation is normal. Evaluate a meaningful sample and other metrics before drawing conclusions.
Can a trading strategy recover after losing effectiveness?
Yes. A strategy may recover if the market returns to a regime where its underlying logic works.
Should I modify a strategy when performance drops?
Only after identifying a credible reason for the deterioration. Constant modification can create Overfitting.
What is the difference between trading signal expiration and strategy lifespan?
Trading signal expiration concerns the validity of one individual trade signal. Strategy lifespan concerns the long-term effectiveness of the entire signal-generating system.
Can a simple strategy remain profitable?
Yes. Simplicity is not inherently a weakness, but simple systems still need robustness and must be monitored as market conditions evolve.
Does algorithmic trading shorten strategy lifespan?
It can. Automated systems can identify and respond to recurring patterns quickly, potentially reducing the longevity of some market inefficiencies.
How should professional traders monitor strategy lifespan?
They can use rolling performance samples, regime analysis, execution metrics, Drawdown, Expectancy and comparisons between live and historical results.
When should a strategy be retired?
Retirement may be appropriate when performance deterioration is persistent, statistically meaningful and evidence suggests the underlying edge has structurally disappeared.
Can a strategy work in every market condition?
Very few strategies perform equally well across all regimes. Understanding when a strategy should and should not operate is often more important than maximizing its historical Win Rate.
What is the biggest lesson about signal strategy lifespan?
No strategy exists independently from the market environment. A strategy remains useful only while the assumptions supporting its edge continue to hold.