
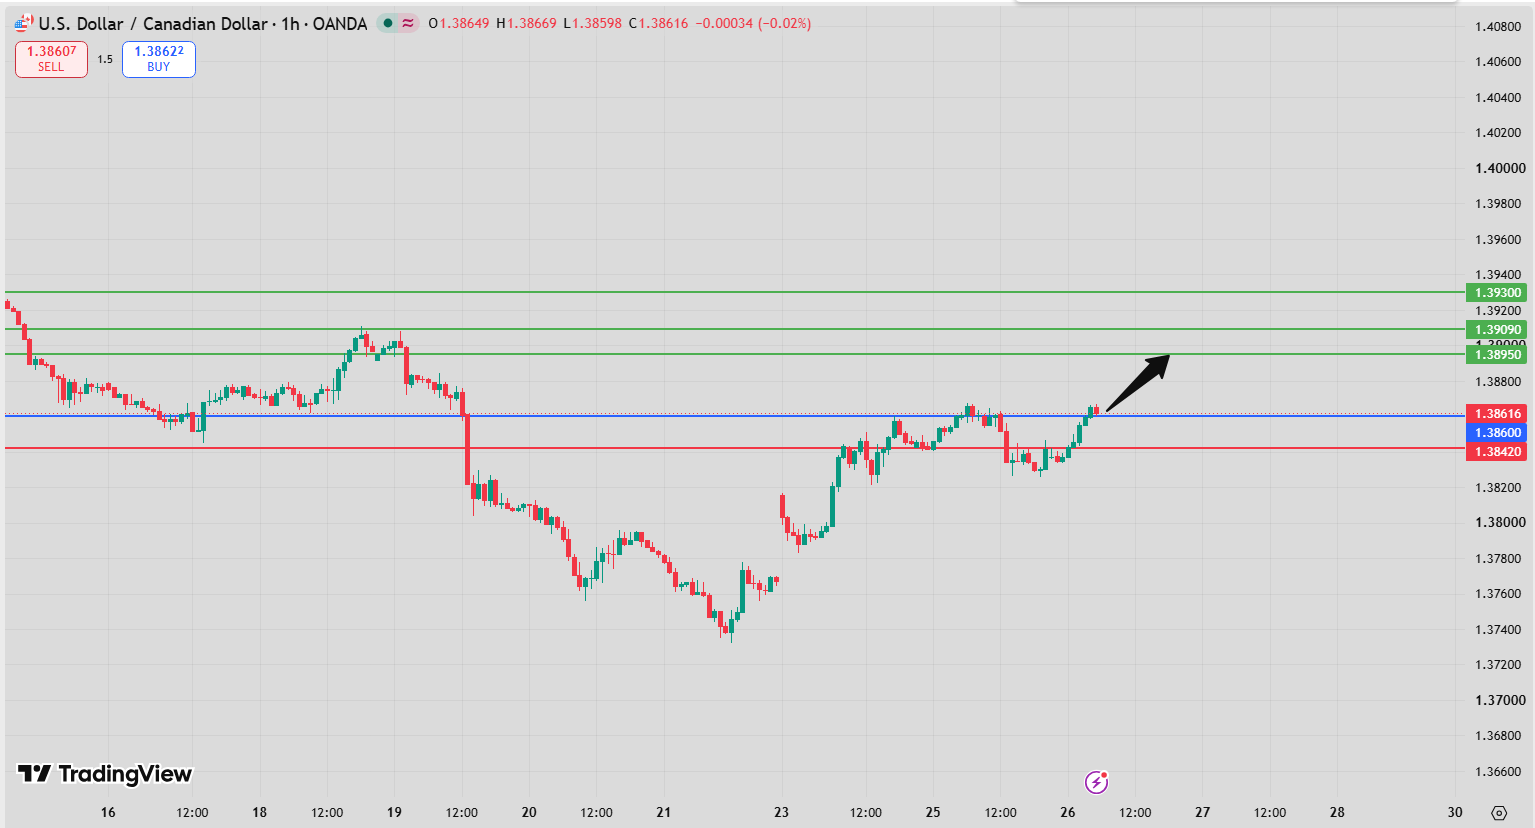
USD/CAD Intraday Forecast: Further Upside Toward 1.3895 and 1.3909 While 1.3842 Holds
Introduction
The USD/CAD Intraday Forecast remains positive as long as 1.3842 continues to act as support. The current technical structure favors further upside, with 1.3895 as the first target and 1.3909 as the second upside objective.
The broader configuration is positive, supported by the position of price above both the 20-period and 50-period moving averages. The MACD is also above its signal line and positive, indicating that bullish momentum remains present.
However, the RSI is currently above 70, placing the market in an overbought area. This does not automatically mean that the uptrend must reverse, as an asset can remain overbought during a strong bullish trend. Nevertheless, it increases the possibility of a temporary correction or consolidation, particularly if bearish divergence begins to appear.
The key technical level remains 1.3842. As long as this pivot holds as support, the bullish scenario remains preferred.
USD/CAD Intraday Forecast Technical Analysis
The USD/CAD Intraday Forecast favors the upside while 1.3842 remains support.
The preferred technical path is:
Above 1.3842 → 1.3895 → 1.3909
The first target at 1.3895 represents the primary upside objective. If buyers maintain control and the pair successfully extends the move beyond this level, the next target becomes 1.3909.
The technical structure is currently supported by the MACD, which is above its signal line and positive.
Price is also positioned above the 20-period moving average at approximately 1.3844 and the 50-period moving average around 1.3848.
This confirms that the short-term structure remains constructive, although the proximity of price to these averages means that 1.3842 remains particularly important for maintaining the bullish bias.
USD/CAD Intraday Forecast Market Sentiment Analysis
The USD/CAD Intraday Forecast currently reflects positive short-term sentiment, but the elevated RSI introduces an important caution factor.
An RSI above 70 generally indicates that the market is in overbought territory. However, overbought conditions can persist during strong trends and should not automatically be interpreted as a sell signal.
The main market drivers for USD/CAD include:
- US dollar movements.
- Canadian dollar strength or weakness.
- Federal Reserve policy expectations.
- Bank of Canada policy expectations.
- Crude oil price movements.
- Treasury yields.
- US economic data.
- Canadian economic data.
- Broader risk sentiment.
The current configuration favors buyers because the MACD remains positive and price is positioned above its moving averages.
Nevertheless, if the RSI begins forming bearish divergence while price approaches the upside targets, the probability of a temporary pullback could increase.
USD/CAD Intraday Forecast Support and Resistance Levels
The key levels in today’s USD/CAD Intraday Forecast are clearly defined.
Key Pivot Support: 1.3842
The main technical support is:
1.3842
As long as USD/CAD remains above this level, the bullish scenario remains valid.
First Target: 1.3895
The primary upside objective is:
1.3895
A move toward this level would confirm continued buying pressure.
Second Target: 1.3909
If buyers maintain momentum beyond the first target, the next objective becomes:
1.3909
Alternative Downside Level: 1.3819
A sustained break below 1.3842 would weaken the bullish structure and expose:
1.3819
Second Alternative Target: 1.3805
If selling pressure accelerates below the pivot, the next downside objective becomes:
1.3805
USD/CAD Intraday Forecast Trading Scenario Analysis
According to the USD/CAD Intraday Forecast, the preferred scenario remains bullish above 1.3842.
Bullish Continuation Scenario
The primary path is:
Above 1.3842 → 1.3895 → 1.3909
As long as 1.3842 acts as support, buyers retain control of the short-term structure.
A move toward 1.3895 would represent the first upside objective. If buyers successfully establish momentum beyond this level, USD/CAD could continue toward 1.3909.
Overbought Pullback Scenario
The RSI is above 70, meaning that the market is technically overbought.
This does not necessarily invalidate the bullish trend. Strong markets can remain overbought for extended periods.
However, if buying momentum begins to weaken, USD/CAD could experience a temporary pullback as traders take profits.
A correction that remains above 1.3842 would not invalidate the broader bullish setup.
Bearish Alternative Scenario
The alternative scenario becomes active below 1.3842.
A decisive break and sustained move below the pivot would weaken the positive configuration and shift attention toward 1.3819.
If sellers maintain control below this level, the next downside objective would become 1.3805.
USD/CAD Intraday Forecast Risk Factors and Alternative Outlook
The main risk to the USD/CAD Intraday Forecast is the elevated RSI.
An RSI above 70 indicates that USD/CAD could be vulnerable to profit-taking or a short-term correction. The key is whether such a correction remains contained above the pivot.
Important risk factors include:
- Stronger Canadian dollar.
- Weakness in the US dollar.
- Changes in Federal Reserve expectations.
- Changes in Bank of Canada expectations.
- Rising crude oil prices.
- Unexpected US economic data.
- Unexpected Canadian economic data.
- Bearish RSI divergence.
- Shifts in global risk sentiment.
The most important technical warning for the bullish scenario would be a decisive break below 1.3842.
Until that occurs, the upside remains the preferred direction.
USD/CAD Intraday Forecast Conclusion
The USD/CAD Intraday Forecast remains bullish above 1.3842, with 1.3895 as the first target and 1.3909 as the second upside objective.
The current configuration is positive. The MACD is above its signal line and positive, while price is trading above both the 20-period and 50-period moving averages.
However, the RSI is above 70, meaning that the pair is technically overbought. This creates the possibility of a temporary correction or consolidation, although it does not automatically invalidate the bullish trend.
The key level remains 1.3842. As long as this pivot continues to hold as support, buyers retain the advantage and the path toward 1.3895 and 1.3909 remains open.
Conversely, a sustained break below 1.3842 would weaken the bullish structure and expose 1.3819 and 1.3805.
Overall, the technical balance favors buyers, but the elevated RSI means that price action around the pivot and the first target should be monitored carefully.
FAQ
What is the current USD/CAD Intraday Forecast?
The USD/CAD Intraday Forecast remains bullish above 1.3842, with targets at 1.3895 and 1.3909.
Why is 1.3842 important?
It is the key pivot support. Holding above this level keeps the bullish scenario active.
What are the upside targets?
The first target is 1.3895, followed by 1.3909.
Is the RSI above 70 a bearish signal?
Not necessarily. An RSI above 70 indicates overbought conditions, but the pair can remain overbought during a strong bullish trend. A bearish divergence would provide a stronger warning of a potential correction.
What do the MACD and moving averages indicate?
The MACD is above its signal line and positive, while price is above both the 20-period and 50-period moving averages. These signals support the current bullish configuration.
What happens below 1.3842?
A sustained break below the pivot would weaken the bullish scenario and could lead toward 1.3819 and 1.3805.

