The MACD Indicator (Moving Average Convergence Divergence) is a technical analysis tool used to identify changes in market momentum, trend direction, and potential trading opportunities. It measures the relationship between two exponential moving averages (EMAs) and helps traders evaluate whether bullish or bearish momentum is strengthening or weakening.
Developed by Gerald Appel in the late 1970s, MACD has become one of the most widely recognized technical indicators in financial markets.
The MACD Indicator is commonly used in Forex, stocks, commodities, cryptocurrencies, and equity indices. Traders analyze its line crossovers, histogram movements, and divergences to assess possible trend continuations or reversals.
Unlike oscillators with fixed boundaries, such as the Relative Strength Index (RSI), MACD fluctuates around a zero line without a predefined upper or lower limit.
The indicator combines trend-following and momentum analysis, making it useful for evaluating directional market conditions.
The MACD Indicator analyzes the difference between a faster and a slower exponential moving average.
An exponential moving average assigns greater weight to recent price observations, allowing it to respond more quickly to price changes than a comparable simple moving average.
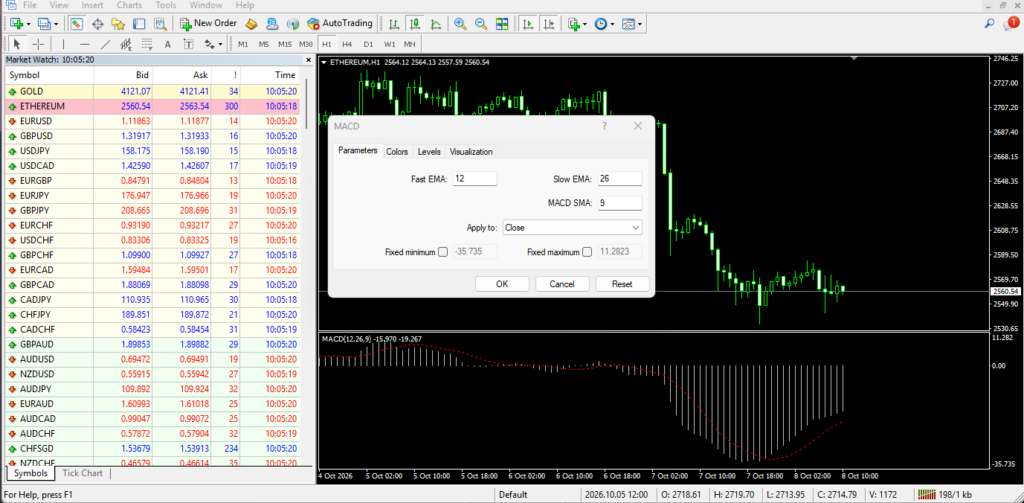
The standard MACD configuration uses three parameters:
These settings are commonly displayed as MACD (12, 26, 9).
The indicator appears in a separate panel beneath the price chart and generally includes two lines and a histogram.
The difference between the 12-period and 26-period exponential moving averages. It indicates the direction and relative strength of the moving-average relationship.
A 9-period exponential moving average of the MACD line. Traders use crossovers between these lines to identify potential changes in momentum.
A series of bars representing the difference between the MACD line and the signal line. It helps visualize whether the two lines are converging or diverging.
Illustrative MACD panel
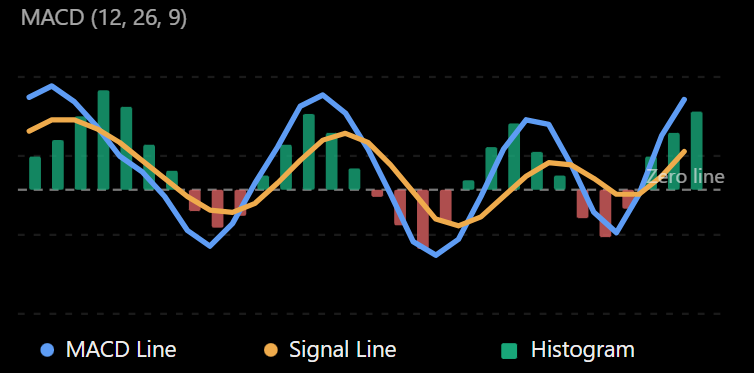
Conceptual illustration, not actual market data. The line colors and histogram conventions may differ between trading platforms.
As the MACD line moves above or below the signal line, the histogram changes accordingly.
For a more detailed technical explanation, traders can consult StockCharts’ MACD Indicator guide.
The MACD Indicator is calculated using exponential moving averages of market prices.
The standard formula is:
MACD = EMA(12) – EMA(26)
Where:
The signal line is calculated as:
The MACD histogram is calculated as:
These formulas allow traders to examine both the moving-average relationship and changes in its momentum.
Suppose the following hypothetical values are observed on a financial instrument:
| Component | Value |
|---|---|
| 12-period EMA | 1.1050 |
| 26-period EMA | 1.1020 |
| 9-period EMA of MACD | 0.0020 |
Step 1: Calculate the MACD Line
Step 2: Identify the Signal Line
Signal=0.0020
Step 3: Calculate the MACD Histogram
Histogram=0.0030-0.0020=0.0010
In this example, the MACD line is above its signal line, producing a positive histogram value.
This suggests that the shorter moving average is above the longer moving average and that MACD is currently above its smoothed signal.
However, these values alone do not establish whether a fresh bullish crossover has occurred.
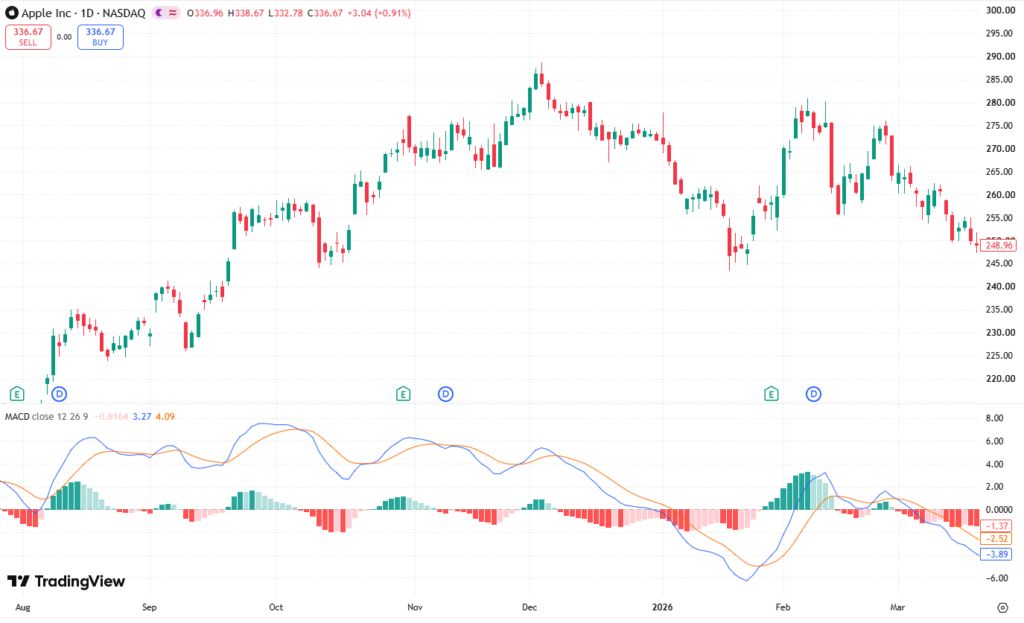
Traders commonly evaluate MACD through signal line crossovers, zero-line crossovers, histogram changes, and divergences.
A bullish MACD crossover occurs when the MACD line crosses above the signal line.
This may indicate strengthening upward momentum.
Potential interpretations include:
A possible shift toward bullish momentum
Improving short-term trend conditions
An opportunity to investigate a long position
Confirmation of an existing bullish price structure
A bullish crossover occurring below the zero line can attract attention because it may signal a recovery in momentum after a bearish phase.
However, it does not guarantee a sustained upward trend.
A bearish MACD crossover occurs when the MACD line crosses below the signal line.
This may indicate weakening bullish momentum or increasing bearish pressure.
Potential interpretations include:
The zero line separates positive and negative MACD values.
A bullish zero-line crossover occurs when the MACD line moves from negative to positive territory.
This means the faster EMA has crossed above the slower EMA.
A bearish zero-line crossover occurs when MACD moves from positive to negative territory.
This means the faster EMA has crossed below the slower EMA.
Zero-line crossovers may help confirm directional trends, although they often occur after a price movement has already developed.
The MACD Histogram measures the distance between the MACD line and the signal line.
Unlike the MACD line itself, the histogram focuses specifically on the relationship between the indicator and its smoothed signal.
When the histogram is above zero, the MACD line is above the signal line.
An expanding positive histogram indicates that this positive difference is increasing.
A shrinking positive histogram indicates that the MACD line and signal line are moving closer together.
When the histogram is below zero, the MACD line is below the signal line.
An increasingly negative histogram indicates that the gap is widening in the negative direction.
A negative histogram moving toward zero indicates that the gap is narrowing.
Histogram changes can provide early indications that momentum within the MACD relationship is changing.
For example, progressively smaller positive bars may suggest weakening upward momentum before a bearish signal-line crossover occurs.
However, decreasing histogram bars do not necessarily mean the market price has started declining.
The histogram reflects changes in MACD relative to its signal line, not the absolute direction of price.
For further explanation, see MACD Histogram technical analysis from StockCharts
MACD divergence occurs when the direction of price movements differs from the direction of the MACD indicator.
Divergence can help traders identify situations in which price momentum may be weakening.
Bullish divergence occurs when:
This suggests that downside momentum may be weakening despite continued price declines.
A bullish divergence can precede a market recovery, but additional price confirmation is recommended.
Bearish divergence occurs when:
This suggests that upward momentum may be weakening while prices continue reaching new highs.
Traders often analyze bearish divergence near established resistance levels.
Divergence is not a guaranteed reversal signal.
During strong trends, price and MACD can remain divergent without producing a substantial change in market direction.
Traders may combine divergence analysis with candlestick patterns, trendlines, and support or resistance levels to improve contextual interpretation.
MACD can be incorporated into different trading strategies depending on market conditions and trading objectives.
This strategy focuses on the relationship between the MACD line and the signal line.
An example bullish setup may involve:
A bearish setup can use the opposite conditions.
Crossovers should not be treated as independent guarantees of profitable trading opportunities.
Traders sometimes combine MACD with a longer-term moving average to evaluate market direction.
For example:
This method attempts to align momentum signals with the broader market trend.
A divergence-based approach focuses on potential changes in momentum.
For a hypothetical bullish setup, traders may look for:
Divergence strategies require particular caution during strong trending markets.
The standard MACD configuration is 12, 26, 9.
However, traders sometimes adjust these parameters according to their trading timeframe and preferred sensitivity.
| Trading Style | Example Settings | Characteristics |
|---|---|---|
| Scalping | 5, 13, 4 | Faster responses, greater noise |
| Day Trading | 8, 17, 9 | More sensitive than standard MACD |
| Swing Trading | 12, 26, 9 | Traditional default |
| Position Trading | 19, 39, 9 | Smoother, slower-moving signals |
These are illustrative configurations rather than established optimal settings.
Shorter moving-average periods generally increase indicator sensitivity, potentially producing earlier but less reliable crossovers.
Longer periods reduce sensitivity and may filter some market noise, although they can introduce additional lag.
The appropriate MACD settings should be evaluated through backtesting, realistic transaction costs, and market-specific analysis.
Trend Identification
MACD helps traders identify the relationship between shorter-term and longer-term price trends.
Momentum Analysis
The indicator provides information about the acceleration or deceleration of the moving-average relationship.
Crossover Signals
MACD and signal-line crossovers offer clear, rule-based conditions that can be incorporated into trading strategies.
Divergence Detection
MACD can reveal potential changes in momentum that may not be immediately apparent in the price chart.
Multiple Market Applications
The indicator can be applied to Forex, stocks, indices, commodities, and cryptocurrencies.
Trading Platform Availability
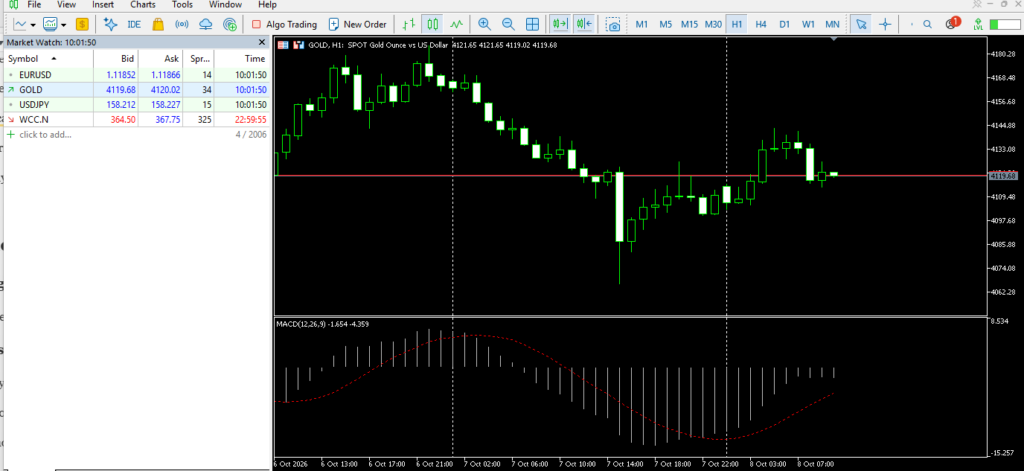
MACD is widely available on platforms such as TradingView, MetaTrader 4 and MetaTrader 5
MACD is derived from historical prices and exponential moving averages. As a result, signals may appear after significant price movements have already occurred.
During sideways markets, MACD can generate repeated crossovers without establishing a sustainable trend.
Limited Overbought and Oversold Interpretation
Unlike RSI, traditional MACD does not operate within a fixed numerical range. Therefore, universal overbought and oversold thresholds cannot be applied.
Unlike RSI, traditional MACD does not operate within a fixed numerical range. Therefore, universal overbought and oversold thresholds cannot be applied.
Unexpected market movements can produce rapid indicator changes that may not develop into sustainable trends.
Absolute MACD values depend on the price scale of the underlying instrument, making direct numerical comparisons across differently priced assets potentially misleading.
MACD does not independently evaluate spreads, slippage, market liquidity, fundamental events, or execution quality.
Proper Risk Management remains essential when using MACD in live trading.
MACD is commonly used in Forex trading to evaluate currency pair trends and potential momentum changes.
Its applications include analyzing major currency pairs such as EUR/USD, GBP/USD, USD/JPY, and AUD/USD.
Consider a hypothetical situation in which EUR/USD is trading above a major support level.
Suppose:
However, traders must still evaluate macroeconomic developments, monetary policy expectations, volatility, and trading costs before executing positions.
Forex markets are particularly sensitive to economic announcements, including inflation reports, employment statistics, and central bank interest rate decisions.
Traders can use the FastPip financial markets platform alongside technical analysis to explore broader market information.
Gold (XAU/USD) traders frequently use MACD to examine trends and identify potential changes in market momentum.
Gold prices are influenced by several fundamental factors, including:
Suppose gold prices are advancing within an established upward trend.
During the movement:
These conditions may indicate that bullish momentum remains supportive of the existing trend.
However, a sudden economic announcement or geopolitical development can quickly change market conditions, regardless of the indicator’s previous readings.
Stock traders use MACD to assess potential trend changes, particularly during directional market movements.
For example, a stock trading above its 200-day moving average while maintaining a positive MACD reading may exhibit characteristics consistent with bullish market momentum.
MACD can also help traders investigate potential momentum weakness during an established uptrend.
However, company earnings announcements, regulatory developments, and corporate actions can produce sudden price changes that technical indicators may not anticipate.
MACD is also used in cryptocurrency markets, including Bitcoin and Ethereum.
Because cryptocurrency markets operate continuously and can experience substantial volatility, indicator behavior may differ across timeframes.
Traders should account for market volatility, liquidity conditions, exchange differences, and potential liquidation events when interpreting MACD signals.
MACD and RSI are both widely used technical indicators, but they measure momentum differently.
| Feature | MACD | RSI |
|---|---|---|
| Full Name | Moving Average Convergence Divergence | Relative Strength Index |
| Indicator Type | Trend-following momentum oscillator | Momentum oscillator |
| Calculation | Difference between EMAs | Average gains versus losses |
| Numerical Range | Unbounded | 0–100 |
| Standard Settings | 12, 26, 9 | 14 periods |
| Primary Signals | Crossovers, zero line, divergence | Overbought, oversold, divergence |
| Traditional Thresholds | Zero line | 30, 50, 70 |
| Typical Use | Trend and momentum analysis | Momentum strength and potential extremes |
Yes. Some traders combine MACD and RSI to obtain complementary momentum information.
For example, a hypothetical bullish setup could include:
MACD crossing above its signal line.
RSI recovering above 50.
Price breaking above an established resistance level.
This combination may provide multiple forms of technical confirmation.
However, MACD and RSI both derive information from historical prices. Their signals are therefore not statistically independent, and combining them does not guarantee better trading performance.
The MACD Indicator provides traders with a structured approach to understanding the relationship between market trends and momentum.
Its practical importance comes from several characteristics.
Trend and Momentum Integration
MACD combines moving-average relationships with momentum analysis in a single indicator.
Objective Trading Conditions
Crossovers and zero-line movements provide measurable technical conditions that can be used in systematic trading strategies.
Momentum Shift Detection
Histogram contractions and divergences may help traders identify changing momentum before certain trend-confirmation signals develop.
Broad Market Compatibility
MACD can be applied across multiple asset classes and trading timeframes.
Support for Automated Strategies
Because MACD calculations are rule-based, they can be incorporated into Algorithmic Trading systems, Expert Advisors, and quantitative trading models.
Nevertheless, the usefulness of MACD depends on the trading environment, risk controls, and how its signals are interpreted.
The MACD Indicator is a technical analysis tool that measures the difference between two exponential moving averages. Traders use it to evaluate market trends, momentum, and potential trading signals.
The traditional MACD settings are 12, 26, and 9. These are widely used across financial markets, but traders may adjust them based on timeframe, volatility, and strategy requirements.
A bullish MACD crossover occurs when the MACD line crosses above its signal line. This may indicate improving upward momentum, although additional confirmation is often required.
A bearish MACD crossover occurs when the MACD line crosses below its signal line. This may indicate weakening upward momentum or increasing bearish pressure.
Neither indicator is universally better. MACD combines trend-following and momentum information, while RSI is commonly used to evaluate momentum strength and potentially overbought or oversold conditions. Their usefulness depends on market conditions and the trading strategy.
Yes. Some Forex scalpers use MACD on lower timeframes with more sensitive settings. However, lower timeframes can generate additional false signals, and transaction costs may significantly affect results.
The MACD histogram represents the difference between the MACD line and the signal line. Positive bars indicate that MACD is above its signal line, while negative bars indicate that MACD is below it.
No. MACD is calculated using historical price information. It can help traders interpret momentum and identify potential trend changes, but it cannot reliably predict future price movements on its own.
Technical Analysis / Trading Indicators / Forex
Related Terms
Relative Strength Index (RSI), Exponential Moving Average (EMA), Moving Average, MACD Histogram, Signal Line, Momentum Indicator, Technical Analysis, Bullish Divergence, Bearish Divergence, Trend Following, Risk Management, Algorithmic Trading