Daily Fundamental Analysis October 16 2026 | FastPip
Daily Fundamental Analysis October 16 2026: 7 Critical Market Signals for Gold, USD & Forex
The Daily Fundamental Analysis October 16 2026 begins with global markets stabilizing after a volatile week dominated by inflation shocks, a sharp correction in AI-related equities, falling US Treasury yields and escalating Middle East energy risks.
Gold is trading near $4,157 per ounce after recovering from Thursday’s lows, while the US Dollar Index has slipped below 102 and is heading toward its first weekly decline in five weeks.
Oil prices remain historically elevated, with Brent near $105 per barrel and WTI around $97, although both benchmarks are slightly lower today.
The most important shift in today’s macro environment is the divergence between inflation data and bond-market behavior.
US CPI and PPI both showed stronger inflation pressure this week.
Normally, this combination should push Treasury yields and the dollar higher.
Instead, investors have moved aggressively into US government bonds because of concerns surrounding the financing of the artificial intelligence boom.
That flight to safety has pushed Treasury yields lower and weakened the dollar, helping gold stabilize.
Today’s seven critical market drivers are:
- US PPI surged far above expectations
- Retail sales remained strong but underlying spending slowed
- Treasury yields fell despite inflation
- The dollar is heading for its first weekly decline in five weeks
- Gold remains supported near $4,150
- Oil remains above $100 amid Middle East supply risk
- US industrial production is the main scheduled macro release today
For updated economic releases, follow the FastPip Economic Calendar.
US PPI Shock: Inflation Pressure Broadens
Thursday’s US Producer Price Index produced one of the week’s largest economic surprises.
Headline PPI increased 1.3% month-over-month in September, the largest monthly increase in approximately four and a half years.
Economists surveyed by Reuters had expected an increase of only 0.5%.
Annual producer-price inflation surged to 6.3%, compared with 5.6% in August.
US PPI Results
| Indicator | Actual | Forecast | Previous |
|---|---|---|---|
| PPI MoM | 1.3% | 0.5% | 0.5% revised |
| PPI YoY | 6.3% | — | 5.6% |
| Energy Prices | +10.8% | — | — |
| Gasoline Prices | +20.3% | — | — |
| Services Prices | +0.8% | — | +0.2% |
The key issue was that inflation was not limited to energy.
Services prices also accelerated sharply, suggesting that producer inflation is broadening through the economy.
Reuters reported that the rise was the strongest since March 2022.
Why the PPI Report Matters
The Federal Reserve focuses mainly on PCE inflation.
However, several components of PPI feed directly into the PCE calculation.
Economists now estimate that September core PCE could increase around 0.3%–0.4% month-over-month.
That would keep underlying inflation significantly above the Fed’s 2% target.
The fundamental implication is:
PPI ↑ → PCE Risk ↑ → Fed-Hike Risk ↑
But financial markets are currently adding another factor:
Risk-Off Demand → Treasury Purchases ↑ → Yields ↓
This explains why the dollar has not strengthened despite hot inflation.
Retail Sales: Strong Headline, Softer Underlying Demand
September US Retail Sales increased 0.8% month-over-month.
That was significantly stronger than the 0.3% consensus forecast.
However, the headline number was heavily influenced by higher gasoline prices.
US Retail Sales Results
| Indicator | Actual | Forecast | Previous |
|---|---|---|---|
| Retail Sales MoM | 0.8% | 0.3% | 1.3% |
| Core Control Sales | 0.1% | — | 1.2% |
| Gas Station Sales | +6.4% | — | — |
| Auto Dealer Sales | +0.2% | — | — |
The core measure used more directly in GDP calculations increased only 0.1%.
That represents a significant slowdown from August.
This means consumers are still spending, but some of the headline strength reflects higher prices rather than stronger real demand.
The combination creates a difficult Federal Reserve environment:
Inflation High + Consumption Slowing
That resembles a mild stagflationary dynamic.
Jobless Claims Remain Historically Low
US Initial Jobless Claims increased slightly to 199,000.
The previous week’s figure was approximately 198,000.
Claims have now remained below 200,000 for five consecutive weeks.
Jobless Claims Data
| Indicator | Actual | Previous |
|---|---|---|
| Initial Jobless Claims | 199K | 198K |
| Continuing Claims | 1.71M | 1.714M |
The labor market therefore remains unusual.
Hiring has weakened substantially, but layoffs remain very low.
This has produced what economists increasingly describe as a:
Low-Hire, Low-Fire Labor Market
Companies are reluctant to expand their workforce aggressively.
However, they are also reluctant to dismiss existing employees.
This reduces the urgency for aggressive Federal Reserve easing.
Daily Fundamental Analysis October 16 2026: Global Market Snapshot
| Asset / Market | Latest Reported Level / Move | Fundamental Signal |
|---|---|---|
| Gold / XAUUSD | ~$4,157 | Supported |
| DXY | ~101.89 | Weekly Bearish |
| EUR/USD | ~$1.1226 | Recovering |
| Brent Oil | ~$105.21 | Slightly Lower |
| WTI Oil | ~$97.20 | Slightly Lower |
| US 10Y Yield | Near 5.1% | Weekly Decline |
| KOSPI | ~+3% | Recovery |
| Nikkei 225 | ~+1.5% | Recovery |
| US Tech Futures | Slightly Lower | Cautious |
The US dollar is heading toward its first weekly decline in five weeks, largely because falling Treasury yields and concerns about AI financing have reduced demand for dollar exposure.
Gold Fundamental Analysis Today
Gold is trading close to $4,157 per ounce.
The metal has experienced a highly volatile week.
Hot CPI and PPI created substantial bearish pressure because they increased expectations for higher interest rates.
However, falling Treasury yields and a weaker dollar have subsequently supported bullion.
This produces a much more balanced fundamental environment.
Gold Bullish Drivers
Gold is currently supported by:
- falling Treasury yields;
- weaker US dollar;
- AI-sector financial stress;
- geopolitical uncertainty;
- Middle East conflict;
- global sovereign-debt concerns.
Gold Bearish Drivers
Gold still faces major risks from:
- persistent US inflation;
- potential December Fed hike;
- high nominal interest rates;
- elevated oil prices;
- potentially stronger US industrial data.
Why Falling Treasury Yields Matter So Much
Gold does not pay interest.
Therefore, the opportunity cost of owning bullion falls when Treasury yields decline.
The current relationship remains:
Treasury Yields ↓ + USD ↓ = Gold Support
This relationship is currently more important than the inflation headline alone.
Gold Bullish Scenario
Gold could strengthen if today’s US industrial data disappoint.
Potential reaction:
Industrial Production ↓
Treasury Yields ↓
USD ↓
Gold ↑
Gold Bearish Scenario
If industrial production significantly exceeds expectations:
US Growth Expectations ↑
Treasury Yields ↑
USD ↑
Gold ↓
Gold Fundamental Bias
Neutral to Mildly Bullish
The decline in Treasury yields creates a constructive environment, but persistent inflation prevents a stronger bullish classification.
Traders can compare this fundamental outlook with current FastPip Trading Signals.
US Dollar Fundamental Analysis
The dollar is heading toward its first weekly decline in approximately five weeks.
The Dollar Index traded near 101.89 during Friday’s session.
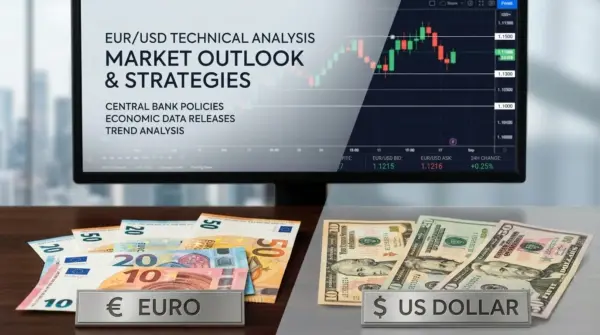
EUR/USD recovered toward 1.1226.
The dollar’s decline is unusual because this week’s inflation data were clearly stronger than expected.
The main explanation is the bond market.
Investors moved into Treasury securities following the sharp selloff in AI-related equities.
Higher Treasury demand pushed yields lower.
Lower yields then reduced the dollar’s interest-rate advantage.
USD Bullish Drivers
- hot CPI;
- extremely hot PPI;
- resilient labor market;
- potential December Fed hike;
- strong US economic growth.
USD Bearish Drivers
- falling Treasury yields;
- AI-sector stress;
- reduced October rate-hike expectations;
- profit-taking after five weeks of gains.
US Dollar Fundamental Bias
Neutral
The dollar remains structurally supported by inflation and relatively strong US growth.
However, falling yields currently limit upside momentum.
Federal Reserve Chair Warsh Avoids Signaling an October Rate Hike
Federal Reserve Chair Kevin Warsh spoke Friday at the IMF-World Bank meetings.
Warsh emphasized the resilience of the US and global economies.
He also reiterated the Fed’s commitment to controlling inflation.
However, he did not provide a clear signal that another rate increase is coming at the October meeting.
This is significant because markets had increased expectations for additional tightening following CPI and PPI.
Warsh’s comments reinforced the idea that policymakers prefer to wait for additional evidence before acting again.
Fed Policy Outlook
The current policy debate can be summarized as:
Inflation → Hawkish
Employment → Dovish
Growth → Resilient
Financial Conditions → Increasingly Tight
This combination makes a December rate increase more plausible than an immediate October move.
Treasury Yields: The Week’s Most Important Signal
The 10-year US Treasury yield has recorded its largest weekly decline in more than a year.
This happened despite:
- hotter CPI;
- hotter PPI;
- strong headline retail sales.
Normally, all three should push yields higher.
Instead, investors bought Treasury securities because of concerns about the financial sustainability of some AI infrastructure investments.
This is extremely important for cross-asset markets.
If yields remain lower:
Gold Benefits
EUR/USD Benefits
Nasdaq Valuation Pressure Eases
DXY Loses Support
If yields rebound:
Gold Faces Pressure
USD Strengthens
Growth Stocks Face Renewed Pressure
AI Markets Stabilize After CoreWeave Shock
Asian technology markets recovered on Friday.
South Korea’s KOSPI gained approximately 3%.
Japan’s Nikkei rose around 1.5%.
The recovery followed Thursday’s severe selloff.
The main concern remains the amount of debt being used to finance AI infrastructure.
CoreWeave became the focal point of these concerns as yields on some of its debt rose sharply.
Investors are questioning whether data-center operators can generate enough cash flow to justify their enormous investment requirements.
Why AI Financing Matters for the Entire Market
The AI boom requires massive investment in:
- data centers;
- semiconductors;
- electricity;
- cooling infrastructure;
- networking hardware;
- cloud computing.
A significant portion of this investment is financed through debt.
Higher interest rates therefore create two problems:
Borrowing Costs ↑
and:
Equity Valuations ↓
This makes AI-related equities particularly sensitive to monetary policy.
Nasdaq Fundamental Outlook
The Nasdaq remains vulnerable but is attempting to stabilize.
Falling Treasury yields are positive for technology valuations.
However, credit concerns within the AI ecosystem remain unresolved.
Nasdaq Bullish Scenario
Technology equities could continue recovering if:
- Treasury yields remain lower;
- industrial production is moderate;
- AI credit spreads stabilize;
- corporate earnings remain strong.
Nasdaq Bearish Scenario
Another selloff could occur if:
- Treasury yields rebound;
- AI debt spreads widen;
- corporate earnings disappoint;
- Fed expectations become more hawkish.
Nasdaq Bias
Neutral
The immediate panic has eased, but financial risks remain elevated.
S&P 500 Fundamental Outlook
The S&P 500 remains close to historically high levels.
However, market breadth is increasingly weak.
Reuters reports that only around 38% of S&P 500 companies are currently above their 50-day moving averages.
This means the broader rally has become heavily dependent on a relatively small group of large companies.
Third-quarter earnings are therefore extremely important.
Analysts expect strong overall earnings growth, but much of that growth comes from the largest technology companies.
S&P 500 Bias
Neutral to Mildly Bullish
Lower Treasury yields provide support, but valuations remain elevated.
Oil Fundamental Analysis Today
Oil prices are slightly lower today but remain on track for weekly gains.
Brent traded around $105.21 per barrel.
WTI traded around $97.20.
WTI is up almost 6% for the week.
The market remains focused on Middle East supply risks.
Shipping through the Strait of Hormuz has fallen substantially compared with normal levels.
Reuters reported average shipping flows of approximately 11.62 million barrels per day, significantly below typical levels.
Oil Bullish Drivers
- Strait of Hormuz disruption
- tanker attacks
- Saudi-Yemeni conflict
- regional geopolitical escalation
- large US inventory draw
- shipping insurance costs
Oil Bearish Drivers
- potential easing of shadow-fleet sanctions
- emergency IEA stock releases
- increased Russian diesel flows
- demand destruction from high prices
IEA Emergency Release
The International Energy Agency has announced emergency oil-stock releases totaling more than 400 million barrels.
More than 20 million barrels of diesel are also being released.
The purpose is to reduce physical shortages and ease extreme pricing pressure in fuel markets.
However, oil remains above $100 because geopolitical risk continues to dominate.
Oil Fundamental Bias
Neutral to Mildly Bullish
The market remains fundamentally tight despite emergency supply measures.
EUR/USD Fundamental Analysis
EUR/USD has recovered toward approximately 1.1226.
The main catalyst is dollar weakness rather than a major improvement in European fundamentals.
The euro had previously suffered five consecutive weekly declines because of:
- French fiscal concerns;
- elevated European borrowing costs;
- energy-price pressure;
- stronger US yields.
EUR/USD Bullish Scenario
EUR/USD could extend its recovery if:
- Treasury yields continue falling;
- industrial production disappoints;
- DXY falls below 101.5.
EUR/USD Bearish Scenario
The recovery could fail if:
- US industrial production is strong;
- Treasury yields rebound;
- European fiscal concerns intensify.
EUR/USD Bias
Neutral to Mildly Bullish
GBP/USD Fundamental Analysis
Sterling is also benefiting from dollar weakness.
The pound received additional support from stronger-than-expected UK economic data earlier this week.
However, high energy prices remain a significant risk for Britain.
GBP/USD Bias
Mildly Bullish
The main driver today remains US dollar direction.
USD/JPY Fundamental Analysis
USD/JPY is under some pressure as US Treasury yields decline.
The pair remains fundamentally supported by the large US-Japan interest-rate differential.
However, lower Treasury yields reduce the attractiveness of the dollar carry trade.
USD/JPY Bias
Neutral to Mildly Bearish
A strong US industrial-production report could reverse today’s pressure.
USD/CAD Fundamental Analysis
USD/CAD remains caught between two competing forces.
Weak Canadian labor-market fundamentals favor a higher USD/CAD.
However, elevated oil prices provide support for the Canadian dollar.
USD/CAD Bias
Neutral
The next major move will depend on the combination of oil and US yields.
Today’s Key Economic Events — October 16, 2026
The Daily Fundamental Analysis October 16 2026 focuses primarily on US industrial and manufacturing data.
All times are GMT / UTC.
| Time GMT | Currency | Event | Actual | Forecast | Previous |
|---|---|---|---|---|---|
| 12:30 | USD | Import Prices MoM | Pending | 0.7%–0.8% | 0.7% |
| 12:30 | USD | Import Prices YoY | Pending | ~7.7%–7.9% | 7.0% |
| 12:30 | USD | Export Prices MoM | Pending | 1.0% | 0.6% |
| 13:15 | USD | Industrial Production MoM | Pending | 0.4% | 0.0% |
| 13:15 | USD | Industrial Production YoY | Pending | 1.0% | 1.4% |
| 13:15 | USD | Manufacturing Production MoM | Pending | 0.3% | -0.3% |
| 13:15 | USD | Capacity Utilization | Pending | 76.5% | 76.3% |
| 17:00 | USD | Baker Hughes Oil Rig Count | Pending | — | 462 |
| 18:00 | USD | US Budget Balance | Pending | -$29B | -$167B |
Consensus figures may vary slightly between economic-calendar providers.
For actual readings after release, follow the FastPip Economic Calendar.
US Industrial Production: Today’s Main Economic Catalyst
September Industrial Production is expected to increase approximately 0.4% month-over-month.
August production was unchanged.
Manufacturing output is expected to rebound around 0.3% after declining 0.3% previously.
Capacity utilization is expected to rise from 76.3% to 76.5%.
The official series is published by the Federal Reserve.
Strong Industrial Production Scenario
If production significantly exceeds forecasts:
US Growth Expectations ↑
Treasury Yields ↑
USD ↑
Gold ↓
USD/JPY ↑
However, stronger production could also support economically sensitive equities.
Weak Industrial Production Scenario
If production disappoints:
Treasury Yields ↓
USD ↓
Gold ↑
EUR/USD ↑
Technology stocks could initially benefit from lower yields.
However, extremely weak production could revive recession concerns.
Import Prices: Another Inflation Test
Import prices are expected to rise around 0.7%–0.8% month-over-month.
Annual import-price inflation could approach 8%.
That matters because the United States is already dealing with high domestic producer inflation.
If imported inflation also accelerates, it would reinforce concerns that inflation pressure is becoming increasingly broad.
Hot Import Prices Scenario
Fed-Hike Risk ↑
USD Support
Gold Pressure
Soft Import Prices Scenario
Inflation Concerns ↓
Treasury Yields ↓
Gold Support
Daily Fundamental Analysis October 16 2026: Market Bias
| Asset | Fundamental Bias | Confidence | Main Driver |
|---|---|---|---|
| Gold / XAUUSD | Neutral → Mildly Bullish | Moderate | Lower yields + weaker USD |
| Silver / XAGUSD | Neutral → Bullish | Moderate | Gold + yields |
| DXY | Neutral | Moderate | Inflation vs falling yields |
| EUR/USD | Neutral → Bullish | Moderate | USD weakness |
| GBP/USD | Mildly Bullish | Moderate | USD weakness |
| USD/JPY | Neutral → Bearish | Moderate | Falling Treasury yields |
| USD/CAD | Neutral | Low | Oil vs Canada weakness |
| S&P 500 | Neutral → Bullish | Moderate | Lower yields + earnings |
| Nasdaq | Neutral | Moderate | AI risk vs lower yields |
| Brent Oil | Neutral → Bullish | Moderate | Middle East risk |
| WTI Oil | Neutral → Bullish | Moderate | Tight physical supply |
| US 10Y Yield | Neutral → Bearish | Moderate | Safe-haven demand |
7 Trader Watchpoints for October 16, 2026
1. Gold Around $4,157
Gold remains supported by lower yields.
A weak industrial-production report could strengthen the recovery.
2. DXY Below 102
The dollar’s first weekly decline in five weeks is an important technical and fundamental signal.
3. US 10-Year Treasury Yield
The bond market remains the most important cross-asset indicator.
4. Industrial Production at 13:15 GMT
This is today’s main scheduled US growth report.
5. Import Prices at 12:30 GMT
Another strong inflation reading could revive rate-hike expectations.
6. AI Credit Markets
Watch credit spreads and debt yields for AI infrastructure companies.
Equity stabilization alone does not mean the credit problem has disappeared.
7. Brent Above $105
Oil remains one of the biggest inflation threats facing central banks.
Final Daily Fundamental Outlook
The Daily Fundamental Analysis October 16 2026 shows that global financial markets are ending the week in an unusual macroeconomic environment.
Inflation data are clearly hot.
US CPI accelerated.
Producer prices recorded their largest monthly increase in more than four years.
Retail sales remained stronger than expected.
Jobless claims remain historically low.
Normally, this combination would produce:
Higher Treasury Yields + Stronger USD + Lower Gold
Instead, Treasury yields have fallen significantly.
The US dollar is heading for its first weekly decline in five weeks.
Gold has stabilized above $4,150.
The explanation is risk aversion.
Concerns surrounding AI investment, data-center debt and technology valuations have pushed investors toward Treasury securities.
This has temporarily overwhelmed the inflation signal in the bond market.
For gold, the strongest bullish combination today is:
Weak Industrial Production + Lower Treasury Yields + DXY Below 102
The strongest bearish combination is:
Strong Industrial Production + Hot Import Prices + Treasury-Yield Rebound
For the dollar, the key question is whether strong US economic data can stop the decline in yields.
For technology stocks, the key question is whether the AI credit-market stress genuinely stabilizes.
For oil, Middle East shipping conditions remain the primary risk.
The central market question today is:
Can US economic resilience push Treasury yields higher again, or will AI-related risk keep investors positioned defensively in government bonds?
The answer will determine whether gold can extend its recovery and whether the dollar’s weekly correction becomes something larger.
For definitions of inflation, PPI, Treasury yields and other concepts used in this analysis, visit the FastPip Financial Glossary.
Frequently Asked Questions
What Is the Daily Fundamental Analysis October 16 2026 Outlook for Gold?
The Daily Fundamental Analysis October 16 2026 suggests a neutral-to-mildly bullish short-term outlook for gold because Treasury yields and the US dollar have weakened.
Persistent inflation remains the main bearish risk.
Why Is Gold Holding Above $4,150 Despite High Inflation?
Gold is receiving support from falling Treasury yields, a weaker US dollar and safe-haven demand related to volatility in AI and technology markets.
Why Is the US Dollar Falling?
The dollar is weakening because Treasury yields have fallen sharply as investors buy government bonds during the technology-sector risk-off move.
What Happened to US PPI?
September PPI surged 1.3% month-over-month, compared with a 0.5% forecast.
Annual producer-price inflation rose to 6.3%.
What Happened to US Retail Sales?
Retail sales increased 0.8%, well above the 0.3% forecast.
However, core control-group sales increased only 0.1%, suggesting softer underlying consumer momentum.
What Time Is US Industrial Production Released Today?
US Industrial Production is scheduled for 13:15 GMT on October 16, 2026.
What Is the Industrial Production Forecast?
Industrial production is expected to increase approximately 0.4% month-over-month, compared with 0.0% previously.
Why Is Oil Still Above $100?
Oil remains elevated because of continued Middle East supply risks, disruption around the Strait of Hormuz and unusually high shipping costs.
Is EUR/USD Bullish Today?
EUR/USD has a neutral-to-mildly bullish fundamental bias because Treasury yields and the US dollar are weakening.
What Should Traders Watch After the Daily Fundamental Analysis October 16 2026?
Following the Daily Fundamental Analysis October 16 2026, traders should monitor US industrial production, import prices, Treasury yields, DXY below 102, gold near $4,157, AI credit conditions, Nasdaq volatility and Brent oil above $105.
 Check Our
  Whether you’re a day trader or a long-term investor, FastPip gives you the tools to trade smarter, not harder.