Drawdown in Signal Services: How to Calculate and Detect Hidden Trading Risk
Drawdown in Signal Services: How to Calculate and Detect Hidden Trading Risk
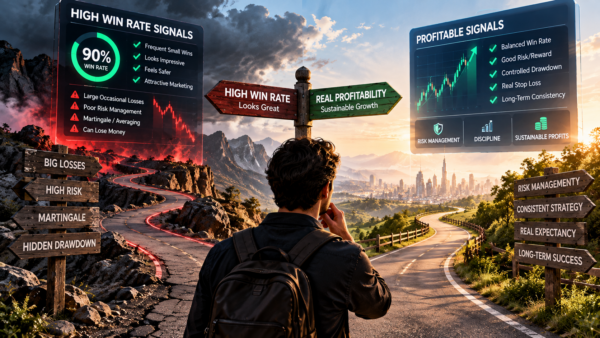
When traders compare signal services, they often start with profit.
A service showing 20% monthly returns or 150% annual growth can immediately look attractive.
But profit tells only one side of the story.
The more important question is:
How much risk was taken to produce that return?
This is where drawdown in signal services becomes one of the most important performance metrics to understand.
Drawdown measures how far an account falls from a previous peak before recovering.
In practical terms, it helps answer questions such as:
- How much capital was lost during the strategy’s worst period?
- How severe were the losing streaks?
- Were open losses included?
- Did the strategy use aggressive leverage?
- Could the account realistically survive another similar decline?
- Was the reported profit achieved with reasonable risk?
Professional performance analysis does not look at returns in isolation. CFA Institute includes maximum drawdown and drawdown duration among the metrics used to evaluate investment performance and emphasizes that performance statistics should be interpreted together rather than individually.
CFA Institute – Portfolio Performance Evaluation
Understanding drawdown can therefore reveal risks that a profit chart alone may hide.
What Is Drawdown in Signal Services?
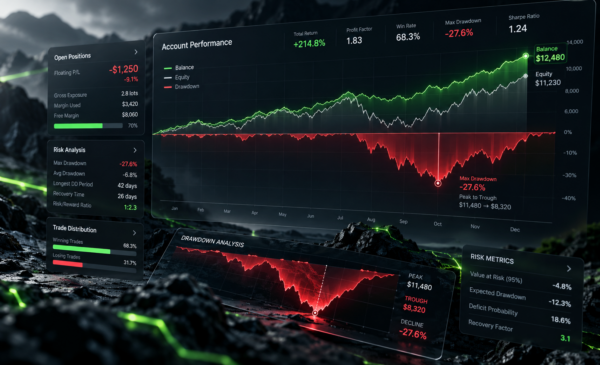
Drawdown is the decline in account value from a previous peak to a subsequent low.
Suppose an account grows from:
$10,000 → $15,000
and then falls to:
$12,000
The account has declined by:
$3,000
Relative to the $15,000 peak:
$3,000 ÷ $15,000 = 20%
So the drawdown is:
20%
This number tells you something that the final account balance does not.
The strategy had to tolerate a 20% decline before continuing.
That information becomes especially important when comparing two signal providers.
Why Drawdown Matters More Than Profit Alone
Imagine two services.
Signal Service A
Annual Return: 50%
Maximum Drawdown: 10%
Signal Service B
Annual Return: 50%
Maximum Drawdown: 60%
Both produced the same return.
But they clearly did not expose users to the same level of risk.
Service B required investors to survive a decline large enough to threaten the viability of many trading accounts.
That difference is why professional traders tend to evaluate:
Return relative to risk
rather than simply:
Return
Maximum drawdown is particularly useful because it shows the largest historical peak-to-trough decline experienced by the strategy.
Drawdown Also Determines How Difficult Recovery Becomes
Losses are asymmetric.
A 10% decline does not require a 10% return to recover.
For example:
| Drawdown | Gain Required to Recover |
|---|---|
| 10% | 11.1% |
| 20% | 25% |
| 30% | 42.9% |
| 40% | 66.7% |
| 50% | 100% |
| 60% | 150% |
This is one of the most important concepts in risk management.
A strategy that loses 50% of its account must subsequently double the remaining capital just to return to breakeven.
That is why controlling drawdown in signal services is not simply about making performance look smoother.
It directly affects the strategy’s ability to survive.
How Drawdown in Signal Services Is Calculated
The standard concept is straightforward.
First, identify the highest account value reached.
This is the Peak.
Then identify the lowest account value reached after that peak before a new high occurs.
This is the Trough.
The percentage drawdown can then be calculated as:
Drawdown = (Peak − Trough) ÷ Peak × 100
For example:
Peak Equity = $20,000
Trough Equity = $14,000
Calculation:
($20,000 − $14,000) ÷ $20,000 × 100
Result:
30% Drawdown
The account lost 30% of its value from its previous peak.
Maximum Drawdown Formula
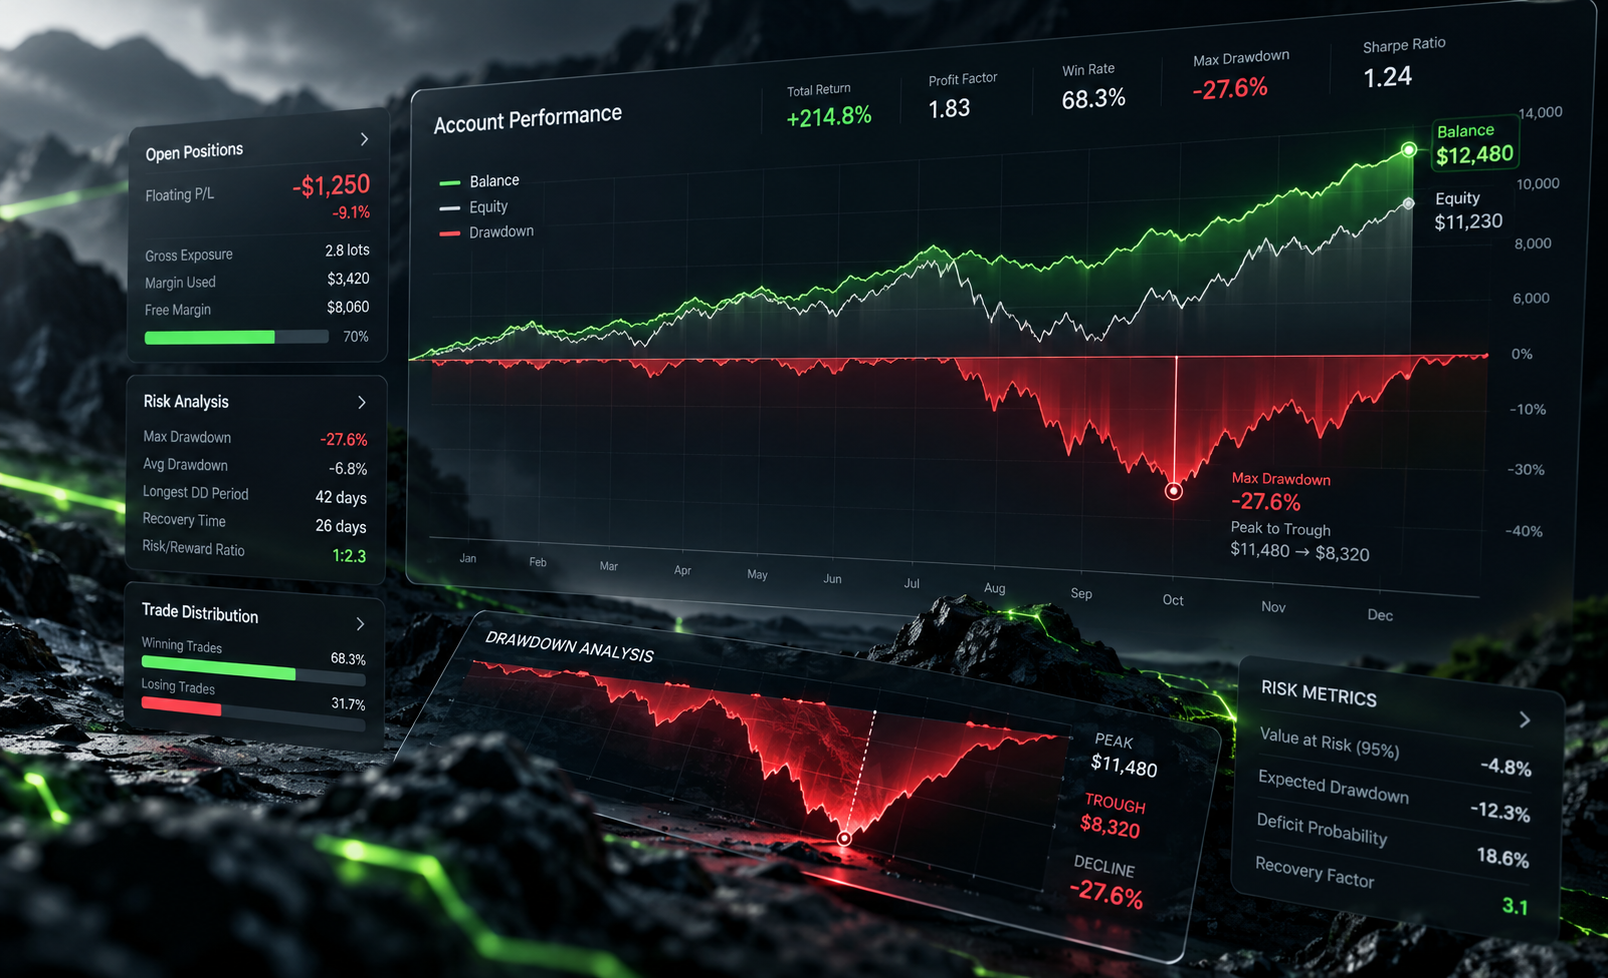
Maximum Drawdown, or MDD, is the largest peak-to-trough decline recorded during the measurement period.
Formula
Maximum Drawdown = (Peak Value − Lowest Subsequent Value) ÷ Peak Value × 100
Suppose account equity changes like this:
$10,000
$13,000
$17,000
$20,000 ← Peak
$18,000
$16,000
$14,000 ← Trough
$18,000
$22,000 ← New Peak
The largest decline occurred from:
$20,000 to $14,000
Therefore:
Maximum Drawdown = 30%
Maximum drawdown is useful because it immediately shows the worst historical capital decline.
But it should not be treated as a guarantee of future risk.
Future drawdowns can always be larger.
Balance vs. Equity: The Most Important Drawdown Difference
One of the most important issues when evaluating drawdown in signal services is determining whether the calculation is based on:
Balance
or:
Equity
These are not the same.
Balance
Balance reflects the account after closed trades.
Open profit and loss are excluded.
Equity
Equity reflects the current real-time value of the account.
It includes:
- Account balance
- Open profits
- Open losses
This distinction can completely change the apparent risk of a strategy.
Example: How Balance Drawdown Can Hide Risk
Suppose an account shows:
Balance: $10,000
But the trader has several open losing positions worth:
-$3,000
The balance still shows:
$10,000
But the equity is only:
$7,000
The account is effectively down:
30%
If the signal provider reports only balance-based statistics, this risk may remain largely invisible.
That is why equity-based analysis is generally more informative when open trades can carry substantial floating losses.
Equity Drawdown vs. Balance Drawdown
Equity Drawdown
Includes unrealized profits and losses from open trades.
It therefore gives a more immediate picture of current account risk.
Balance Drawdown
Uses closed-trade balance values.
Open losses are not reflected until positions are closed.
A strategy using:
- Grid trading
- Martingale
- Averaging down
- Long-duration recovery positions
can potentially show a relatively smooth balance curve while equity is experiencing severe stress.
That is one of the main reasons investors should examine both curves whenever possible.
The Main Types of Drawdown
There is more than one drawdown metric.
Understanding the differences can prevent misleading comparisons.
Absolute Drawdown
Absolute Drawdown measures how far the account fell below its original starting capital.
Suppose an account starts with:
$10,000
and falls to:
$8,000
Absolute Drawdown:
$2,000
This tells you how much original capital was lost.
Maximum Drawdown
Maximum Drawdown measures the largest decline from any historical peak to a later trough.
If the account grows from:
$10,000 → $20,000
and then falls to:
$12,000
the decline is:
40%
Even though the account remains above its original $10,000 starting balance, it has still suffered a significant maximum drawdown.
Relative Drawdown
Relative Drawdown expresses the decline as a percentage of the account peak.
This makes comparison easier between accounts of different sizes.
A $5,000 loss means very different things in:
A $10,000 account
versus:
A $100,000 account.
Percentage-based drawdown puts those declines into proper context.
Equity Drawdown
Equity Drawdown includes floating profit and loss.
For signal-service evaluation, this can be particularly important because it reveals stress from currently open positions.
Balance Drawdown
Balance Drawdown uses only realized account values.
It can be useful, but it may understate risk when substantial open losses exist.
Floating Loss Can Completely Change the Risk Picture
Floating Loss refers to unrealized losses on positions that remain open.
A trade does not have to be closed for the economic loss to matter.
Suppose:
Balance = $10,000
Floating Loss = -$2,000
Equity = $8,000
Although the balance report may look unchanged, the account has effectively experienced a 20% equity decline.
This becomes particularly important when evaluating signal providers that hold losing trades for long periods.
A provider may claim:
“We have not closed a losing trade.”
But that does not necessarily mean there is no loss.
The loss may simply remain open.
Martingale and Grid Systems Can Hide Drawdown
Martingale and grid-style systems deserve special attention.
These strategies may:
- Keep losing positions open
- Add new positions as price moves against the original trade
- Increase total exposure
- Attempt to recover when price reverses
During normal market conditions, the strategy may generate frequent small profits.
Balance may continue rising.
But equity can decline sharply during prolonged adverse moves.
This creates one of the classic situations where:
Balance performance looks strong
while:
Real account risk is deteriorating
This is why professional evaluation should not stop at reported monthly returns.
Why Some Signal Providers Understate Drawdown
There are several ways a performance report can make risk appear lower than it really is.
Using Balance Instead of Equity
Open losses remain outside the drawdown calculation.
Showing Only a Limited Time Period
A provider may show six strong months while an earlier large drawdown remains outside the displayed history.
Starting a New Account
A poor historical period disappears when performance tracking restarts from a new account.
Showing Only Maximum Drawdown
Other information such as drawdown duration or repeated smaller declines may remain hidden.
Excluding Floating Loss
Open positions may contain substantial unrealized risk.
Selective Screenshots
Screenshots provide a snapshot, not an independently verifiable historical record.
A trustworthy service should clearly explain how its drawdown statistics are calculated.
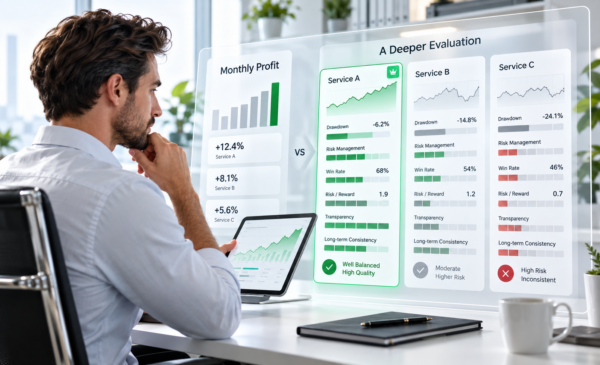
Profit vs. Drawdown: Which Matters More?
Neither return nor drawdown should be evaluated alone.
Instead, evaluate the relationship between the two.
Consider:
Strategy A
Annual Return: 120%
Maximum Drawdown: 60%
Strategy B
Annual Return: 70%
Maximum Drawdown: 12%
Strategy A earns more.
But it also exposes capital to dramatically greater historical stress.
Depending on the investor’s risk tolerance, Strategy B may offer the stronger risk-adjusted profile.
This is why professional portfolio analysis often includes drawdown alongside returns rather than treating either measure independently. CFA Institute describes maximum drawdown as one of the tools available for evaluating investment performance and risk.
Calmar Ratio and Drawdown
The Calmar Ratio compares return with maximum drawdown.
A simplified form is:
Calmar Ratio = Annualized Return ÷ Maximum Drawdown
Suppose:
Annual Return = 30%
Maximum Drawdown = 10%
Calmar Ratio:
3.0
Now consider:
Annual Return = 60%
Maximum Drawdown = 50%
Calmar Ratio:
1.2
The second strategy produced more raw profit but a weaker return relative to its historical drawdown.
This illustrates why risk-adjusted metrics can reveal information raw returns cannot.
Recovery Factor
Recovery Factor also compares performance with drawdown.
A common simplified version is:
Recovery Factor = Net Profit ÷ Maximum Drawdown
The purpose is to estimate how effectively the strategy generated profit relative to its worst decline.
Higher values generally indicate that the strategy produced more return for the drawdown experienced.
Like all metrics, however, it should be used together with other performance information.
Drawdown Duration Matters Too
Two strategies can both have a 20% maximum drawdown.
But consider:
Strategy A
20% drawdown
Recovered in 3 weeks
Strategy B
20% drawdown
Recovered after 11 months
The percentage decline is identical.
The experience for investors is very different.
Drawdown duration matters because extended underwater periods can create:
- Psychological pressure
- Opportunity cost
- Investor withdrawals
- Strategy abandonment
- Increased behavioral mistakes
When evaluating drawdown in signal services, always ask both:
How deep was the drawdown?
and:
How long did recovery take?
Real Accounts vs. Demo Accounts
Drawdown statistics from demo accounts should be interpreted carefully.
Demo trading may not perfectly reproduce:
- Slippage
- Liquidity
- Execution delays
- Spread widening
- Partial fills
- Real-money psychology
A strategy dependent on very fast execution may therefore experience different results in live conditions.
FastPip’s guide to different trading styles also explains that execution requirements and risk characteristics vary considerably across trading approaches.
Internal Link
When possible, long-term verified live performance is generally more informative than a short demo track record.
Drawdown and Money Management Are Closely Connected
Drawdown often reveals how aggressively a strategy is managing capital.
Consider two traders using exactly the same entries.
Trader A
Risk per trade: 1%
Trader B
Risk per trade: 10%
After five consecutive losing trades, their outcomes will be very different.
The strategy did not change.
The risk model did.
This is why drawdown frequently tells you as much about position sizing as it does about trade selection.
FastPip’s introductory trading material also stresses that trading style and market choice must align with capital and risk tolerance rather than being evaluated only through potential profits.
Internal Link
Leverage Can Magnify Drawdown
Leverage magnifies exposure.
That means it can magnify both:
Profit
and:
Loss
A strategy may appear extremely profitable when leverage works in its favor.
But the same leverage can cause account equity to decline rapidly when several trades move against the strategy.
When reviewing signal-service drawdown, therefore examine:
- Typical leverage
- Position size
- Number of simultaneous positions
- Correlated exposures
- Risk per trade
A low historical drawdown achieved with conservative exposure is very different from one produced during only a short favorable market period with aggressive leverage.
How Brokers and Platforms Calculate Drawdown
Different platforms may present drawdown differently.
They may vary in:
- Balance vs. equity basis
- Sampling frequency
- Historical period
- Treatment of deposits and withdrawals
- Treatment of floating P/L
- Peak calculation methodology
This means a 15% drawdown shown on one report cannot always be assumed to be calculated identically to a 15% drawdown shown elsewhere.
Before comparing two signal providers, verify that their statistics use comparable methodology.
Drawdown Across Forex, Crypto and Stocks
Drawdown should also be interpreted in the context of the market.
Different asset classes have different volatility profiles.
Forex
Major currency pairs typically experience lower day-to-day percentage volatility than many cryptocurrencies.
But leverage can still create substantial account drawdown.
Cryptocurrency
Crypto markets can experience much larger percentage moves in short periods.
That means raw drawdown percentages may naturally be higher for some crypto strategies.
Stocks
Drawdown varies substantially depending on:
- Individual stocks
- Portfolio diversification
- Market capitalization
- Leverage
- Holding period
- Market cycle
Therefore, a universal rule such as:
“Anything above 10% drawdown is bad”
is too simplistic.
Drawdown must always be interpreted relative to the strategy, market, return profile, and investor risk tolerance.
Why Comparing Drawdown Across Markets Can Be Misleading
Suppose:
Crypto Strategy: 20% Drawdown
Forex Strategy: 20% Drawdown
Those numbers look identical.
But they may represent very different levels of strategy aggressiveness given the underlying volatility and leverage.
The correct question is not:
Which strategy has the smaller number?
It is:
Was the drawdown reasonable relative to the return, volatility, market, and risk framework?
Is Low Drawdown Always Better?
Not necessarily.
Suppose:
Service A
Annual Return: 8%
Maximum Drawdown: 3%
Service B
Annual Return: 60%
Maximum Drawdown: 12%
Simply choosing Service A because its drawdown is lower ignores the return side of the equation.
Professional evaluation seeks an appropriate balance between:
- Return
- Drawdown
- Volatility
- Consistency
- Recovery speed
- Risk tolerance
Low drawdown is desirable.
But risk-adjusted performance is more useful than chasing the smallest drawdown number possible.
Common Mistakes When Evaluating Drawdown in Signal Services
Looking Only at Monthly Profit
High returns can hide severe drawdowns.
Looking Only at Maximum Drawdown
You should also examine frequency and duration.
Ignoring Equity
Floating losses can remain invisible in balance-only reports.
Comparing Different Time Periods
A three-month track record cannot be directly compared with five years of verified history.
Assuming Historical Drawdown Is a Maximum Future Limit
Future market conditions can produce larger losses.
Ignoring Deposits and Withdrawals
Cash flows can distort account curves if the reporting methodology is unclear.
Ignoring Position Sizing
The same strategy can generate dramatically different drawdowns with different risk settings.
Assuming Zero Drawdown Is the Goal
No realistic trading strategy avoids all declines.
The objective is controlled and survivable drawdown.
How to Evaluate a Signal Service Using Drawdown
Before following a signal provider, ask:
1. Is Drawdown Based on Equity or Balance?
Prefer to understand both.
2. What Is the Maximum Drawdown?
Look at the worst historical peak-to-trough decline.
3. How Long Did the Worst Drawdown Last?
Recovery time matters.
4. Are Open Losses Included?
Floating losses should not be ignored.
5. Is the Account Live or Demo?
Execution conditions matter.
6. How Long Is the Track Record?
Longer records provide more information about different market regimes.
7. Are Deposits and Withdrawals Clearly Identified?
Cash flows should not be confused with performance.
8. Does the Strategy Use Martingale or Grid Logic?
These approaches can create large hidden equity drawdowns.
9. What Is the Return-to-Drawdown Relationship?
Higher returns are not automatically better if they require excessive risk.
10. Is the Data Independently Verifiable?
Transparent performance history is more useful than screenshots.
How Much Drawdown Is Acceptable?
There is no universal acceptable percentage.
The answer depends on:
- Strategy
- Market
- Leverage
- Return target
- Investor risk tolerance
- Time horizon
- Portfolio diversification
A 15% drawdown may be acceptable for one aggressive strategy and completely inappropriate for another conservative mandate.
The correct question is not:
“What is a good drawdown?”
It is:
“Is this level of drawdown reasonable for the return and risk characteristics of this strategy?”
Can Future Maximum Drawdown Be Predicted?
Not precisely.
Historical data can help estimate potential risk.
Backtests, simulations, stress tests, and Monte Carlo analysis may help traders explore possible future drawdown scenarios.
But the future can always exceed historical observations.
Maximum Drawdown should therefore be treated as:
Evidence about historical risk
not:
A guaranteed future risk limit
Risk management should always include a margin for scenarios worse than the historical record.
Conclusion: Drawdown Reveals the Risk Hidden Behind Returns
Profit is easy to advertise.
Risk is harder to see.
That is why drawdown in signal services deserves as much attention as returns—often more.
A professional evaluation should examine:
- Maximum Drawdown
- Relative Drawdown
- Equity Drawdown
- Balance Drawdown
- Floating Loss
- Drawdown duration
- Recovery speed
- Position sizing
- Leverage
- Return-to-drawdown ratios
- Strategy structure
One of the most important lessons is the distinction between Balance and Equity.
A strategy may show excellent closed-trade statistics while carrying substantial unrealized losses.
That is particularly relevant for martingale, grid, and averaging systems.
Maximum drawdown is therefore not simply a statistic buried in a performance report.
It tells you how much pressure the strategy has historically placed on investor capital.
CFA Institute’s performance-evaluation framework similarly treats maximum drawdown and drawdown duration as useful tools for assessing performance quality while emphasizing that no single metric should be interpreted in isolation.
A good signal service is not simply one that makes money.
It is one that produces returns through a transparent and survivable risk process.
Before asking:
“How much profit did this service make?”
ask:
“What did the account have to survive to make that profit?”
The answer is often hidden in the drawdown.
Frequently Asked Questions
What is drawdown in signal services?
Drawdown in signal services is the decline in account value from a previous peak to a later trough. It helps traders understand how much capital a strategy lost during adverse periods.
How is drawdown calculated?
A common formula is:
(Peak Value − Trough Value) ÷ Peak Value × 100
This produces the percentage decline from the previous account peak.
What is Maximum Drawdown?
Maximum Drawdown is the largest historical peak-to-trough decline recorded during the measurement period.
What is the difference between Balance Drawdown and Equity Drawdown?
Balance Drawdown uses closed-trade account values. Equity Drawdown also includes unrealized gains and losses from open positions.
Which drawdown is more useful for signal services?
Equity-based drawdown can be particularly useful because it includes floating losses and therefore provides a more immediate view of account risk.
Can a signal provider hide drawdown?
Risk can appear understated if a provider reports only balance data, excludes open losses, uses a limited history, or selectively presents performance periods.
Why are floating losses important?
Floating losses reduce real account equity even though the trades have not yet been closed. Ignoring them can understate actual risk.
Does a low drawdown always mean a better signal service?
No. Drawdown should be evaluated together with return, consistency, market volatility, leverage, and recovery time.
Is a 20% drawdown high?
It depends on the strategy and market. A 20% drawdown may be excessive for a conservative strategy but less unusual for a higher-volatility mandate.
Why does a 50% drawdown require a 100% gain to recover?
After a 50% loss, only half the original capital remains. Doubling that remaining capital is necessary to return to the original account value.
Can future drawdown be predicted from historical drawdown?
Not exactly. Historical drawdown helps estimate risk, but future market conditions can always produce larger declines.
What should I check before using a signal provider?
Check equity and balance drawdown, maximum drawdown, floating losses, leverage, position sizing, recovery duration, live-account history, strategy structure, and whether performance data can be independently verified.