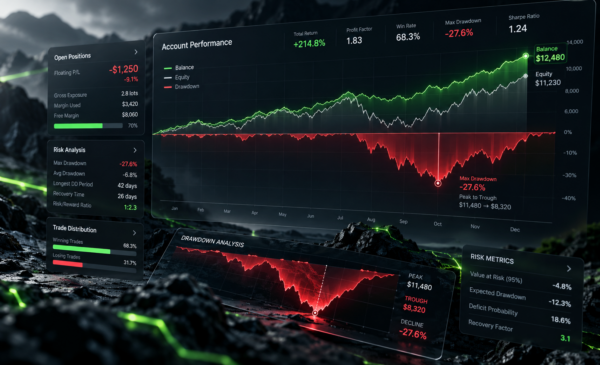
Why Trading Signal Results Differ Between Your Account and the Provider
Why Trading Signal Results Differ Between Your Account and the Provider
A signal provider publishes a profitable trade.
You receive the same signal, trade the same instrument, and follow the same direction.
Yet your result is smaller.
Sometimes your account may even record a loss while the provider reports a profit.
This creates one of the most common questions among signal users:
Why are trading signal results different if both accounts received the same trade?
The answer is that a trading signal is only one part of the execution process.
A signal may define:
- Instrument
- Direction
- Entry
- Stop Loss
- Take Profit
- Trade-management instructions
But your final result is also affected by:
- Execution speed
- Slippage
- Broker pricing
- Spread
- Commission
- Account type
- Liquidity
- Leverage
- Position size
- Internet latency
- Market volatility
- Entry delay
- Manual intervention
Two traders can therefore receive exactly the same signal and still achieve different outcomes.
This does not automatically mean that the signal is wrong or that the provider’s performance is misleading.
It means that signal generation and signal execution are two different parts of the trading process.
Understanding that difference is essential if you want to evaluate trading signals professionally.
Do the Same Trading Signals Guarantee the Same Results?
No.
Receiving the same signal means receiving the same trading opportunity.
It does not guarantee an identical result.
Suppose a provider issues:
EURUSD BUY @ 1.1000
The provider enters immediately at 1.1000.
You see the notification several seconds later and enter at:
1.1008
You are now eight pips behind the original entry.
If the target is relatively close, that difference can materially reduce the reward available to you.
The trade direction is identical.
The execution is not.
The same principle applies to exits.
The provider may close a position at one price while your broker executes the order several points away.
This is why trading signal results should always be evaluated together with execution conditions.
1. Execution Speed Can Change Trading Signal Results
Markets do not stop while a signal is being delivered.
The moment a provider enters a trade, the price continues moving.
The signal then needs to:
- Leave the provider’s system.
- Reach the messaging platform or copy system.
- Reach your device or trading infrastructure.
- Be processed by you or the automation.
- Reach your broker.
- Reach the execution venue or liquidity source.
- Be filled.
Every stage introduces potential latency.
In a slow market, this may make very little difference.
In a fast market, the difference can be significant.
Investor.gov notes that trade execution is not instantaneous and that prices can change between the time an order is submitted and the time it reaches the market for execution.
Investor.gov – Executing an Order
External DoFollow Link
The effect becomes much more important in:
- Scalping
- News trading
- Gold trading
- Fast-moving currency pairs
- Index trading
- Crypto trading
- Short-duration strategies
A strategy targeting 100 pips may tolerate several pips of execution difference.
A strategy targeting only 10 pips may not.
2. Slippage Can Create Different Trading Signal Results
Slippage occurs when an order is executed at a different price from the expected price.
Suppose the signal says:
BUY EURUSD @ 1.1000
But your order is filled at:
1.1004
You experienced four pips of negative slippage.
The provider may still have entered at 1.1000.
You are now executing the same idea from a less favorable price.
Slippage becomes more common when:
- Volatility increases
- Liquidity decreases
- Major economic data is released
- Central banks announce decisions
- Large orders hit the market
- Prices move rapidly between levels
Market orders prioritize execution rather than guaranteeing an exact price. Investor.gov similarly explains that market orders generally execute quickly but do not guarantee the execution price shown when the order is placed.
This is one reason two accounts can receive different results from the same signal.
Positive vs. Negative Slippage
Slippage is not always negative.
Negative Slippage
You receive a worse price than expected.
For a BUY signal:
Expected entry: 1.1000
Actual entry: 1.1004
Positive Slippage
You receive a better price than expected.
Expected entry: 1.1000
Actual entry: 1.0997
Over many trades, the quality of execution can materially affect overall performance.
This is why comparing only the provider’s published entries with your final profit is not enough.
You should also record your actual fill prices.
3. Spread Can Reduce the Profitability of a Signal
Spread is another major reason trading signal results differ between users.
The spread is the difference between the Bid and Ask prices.
It represents one of the primary transaction costs of trading.
Suppose a strategy targets only a small market movement.
Provider’s effective spread:
0.5 pip
Your spread:
2.5 pips
You begin each trade with an additional two-pip disadvantage.
That may seem small.
But across hundreds of trades, the cumulative impact can become substantial.
Why Spread Matters More in Scalping
Consider a strategy targeting:
10 pips per trade
If total transaction costs consume three pips, approximately 30% of the gross target is already gone before considering slippage or commission.
Now consider a swing trade targeting:
150 pips
The same three-pip cost is much less significant.
This explains why execution conditions are especially important for scalping signals.
FastPip’s guide to different trading styles also notes that transaction costs and slippage can materially affect short-term trading strategies.
Internal Link
4. Your Broker Can Change the Outcome of the Same Signal
Not all brokers provide identical execution conditions.
Two brokers may differ in:
- Liquidity providers
- Price feeds
- Server infrastructure
- Execution model
- Spread
- Commission
- Slippage
- Stop levels
- Order-processing speed
- Symbol specifications
This means two traders can click BUY at almost the same time and still receive different execution prices.
The difference may be minor on one trade.
Over hundreds of trades, however, small differences can compound.
Why Prices Can Differ Between Brokers
There is not necessarily one identical retail price feed across every broker.
Different brokers may aggregate prices from different liquidity sources.
As a result:
Broker A may show EURUSD at:
1.1000
while Broker B briefly shows:
1.1002
Normally the difference may be small.
During fast markets, it can widen.
This matters when the signal uses:
- Tight Stop Losses
- Tight Take Profits
- Breakout entries
- Scalping
- News execution
A Take Profit may trigger on the provider’s broker but miss by a small amount on another broker.
Likewise, your Stop Loss might trigger while the provider’s trade remains open.
5. A Few Pips Can Change the Risk-to-Reward Ratio
Suppose the original signal is:
Entry: 1.1000
Stop Loss: 1.0980
Take Profit: 1.1040
Original structure:
Risk: 20 pips
Reward: 40 pips
Risk-to-Reward:
1:2
Now suppose you enter late at:
1.1010
If you keep the same Stop Loss and target:
Risk: 30 pips
Reward: 30 pips
Your risk-to-reward has changed to:
1:1
It is no longer the same trade mathematically.
The signal is unchanged.
Your execution has changed the structure.
This is why blindly chasing an entry after the price has already moved can be dangerous.
6. Delayed Signal Delivery Can Destroy the Original Edge
Manual signal delivery always introduces some delay.
The provider identifies the opportunity.
The message is created.
The platform distributes it.
You receive a notification.
You open it.
You open MetaTrader.
You calculate your position size.
You place the trade.
Meanwhile, the market is still moving.
Suppose the provider enters gold at:
3400
By the time you execute:
3407
The original setup may still eventually reach its target.
But your result can be significantly worse.
In some situations, the proper decision is not to chase the trade at all.
When Entry Delay Matters Most
Delay becomes particularly important in:
Scalping
Targets are small and timing is critical.
News Trading
Prices can move dramatically within seconds.
Breakout Trading
The market may accelerate rapidly after the breakout.
Gold and Indices
Short periods of high volatility can cause substantial movement.
Low-Liquidity Conditions
Price gaps and slippage can increase.
The shorter the strategy’s holding period, the more important execution generally becomes.
7. News Trading Can Produce Very Different Results
Economic announcements can create extreme execution differences.
Examples include:
- CPI
- Nonfarm Payrolls
- Central-bank decisions
- Interest-rate announcements
- Employment data
- Inflation reports
During major releases:
- Spreads can widen
- Liquidity can disappear
- Slippage can increase
- Prices can jump between levels
- Orders may fill at worse prices
A provider may obtain an excellent fill.
A user receiving the signal several seconds later may enter after a large part of the move has already occurred.
This is why news-based signals often produce wider performance dispersion between users.
8. ECN, Raw Spread and Standard Accounts Can Produce Different Results
Account type also affects execution.
Standard Account
Typically:
- Wider spread
- Often no separate commission
- Simple cost structure
Raw Spread Account
Typically:
- Lower raw spread
- Separate commission
- More transparent transaction-cost structure
ECN-Style Account
Depending on the broker’s structure, these accounts may provide:
- Tight spreads
- Commission-based pricing
- Access to multiple liquidity sources
- Execution designed for active traders
The exact terminology varies between brokers.
The important point is that the provider and user may not be trading under the same cost structure.
Example: Standard vs. Raw Spread Account
Suppose the provider trades an intraday strategy using a Raw Spread account.
Average spread:
0.3 pip
The user executes the same signals on a Standard account.
Average spread:
2.0 pips
Difference:
1.7 pips per trade
Across 300 trades:
510 pips of gross execution difference
This simplified example illustrates why account structure matters.
9. Commission Also Changes Net Trading Signal Results
Spread is not the only transaction cost.
Commission matters too.
Suppose a strategy produces:
$30 gross profit per trade
but your total commission is:
$8
Net result:
$22
If the provider’s commission is only $4:
Provider net result:
$26
Your net result:
$22
That difference becomes substantial across a large sample of trades.
This is why performance should ideally be evaluated using net results after costs.
10. Leverage Does Not Automatically Mean More Profit
Users often misunderstand leverage.
Leverage determines how much market exposure can be controlled relative to available margin.
But leverage itself does not create profitability.
A difference in leverage can affect:
- Available margin
- Maximum position size
- Margin level
- Stop-out risk
- Ability to copy multiple positions
Suppose a provider uses:
1:500 leverage
while your account has:
1:100
Attempting to replicate identical lot sizes may use much more of your available margin.
If several trades open simultaneously, your account may encounter margin limitations before the provider does.
11. Position Size Is Often More Important Than Leverage
A common mistake is focusing on leverage while ignoring actual trade size.
Suppose:
Provider account: $100,000
Trade size: 1 lot
User account: $1,000
If the user blindly copies:
1 lot
the two accounts are not taking comparable risk.
The correct question is not:
What lot size is the provider using?
It is:
What percentage of capital is the provider risking?
This distinction is critical.
Professional risk management generally scales exposure relative to account size and Stop Loss distance.
12. Changing Position Size Changes the Strategy
Suppose a provider risks:
1% per trade
A user decides to increase risk to:
5% per trade
The entries remain identical.
The Stop Loss remains identical.
The signal remains identical.
But the portfolio is now following a completely different risk profile.
A losing streak that causes a manageable drawdown for the provider can create severe damage for the user.
Therefore, comparing percentage returns without comparing risk settings can be misleading.
13. Account Size Can Affect Practical Execution
Large and small accounts may also face different practical constraints.
Differences can include:
- Minimum lot size
- Position-size granularity
- Margin availability
- Number of simultaneous positions
- Ability to scale risk precisely
Suppose the mathematically appropriate trade size is:
0.006 lot
but the broker’s minimum trade size is:
0.01 lot
A small account may be forced to take more risk than intended or skip the trade entirely.
This creates another source of variation in trading signal results.
14. Internet Latency Can Affect Entry and Exit
When trades are executed manually or through software connected to a broker, network latency can matter.
The communication path might include:
Your device → Internet → broker server → execution infrastructure
A lower-latency connection can reduce transmission delays.
A slower or unstable connection can increase them.
In slow markets, the difference may be irrelevant.
In fast-moving markets, it may influence fill quality.
Ping and Execution
Ping measures network latency.
For example:
10 ms
versus:
200 ms
does not guarantee a specific financial outcome.
But for latency-sensitive systems, faster and more stable connectivity can reduce one source of delay.
This is one reason algorithmic traders and some signal users operate through VPS infrastructure.
15. What Does a VPS Actually Improve?
A Virtual Private Server can run a trading platform continuously in a data center.
Potential benefits include:
- Stable connectivity
- Reduced dependence on the user’s home internet
- Continuous operation
- Potentially lower network latency to broker infrastructure
- Better reliability for automated systems
A VPS does not make a bad strategy profitable.
It improves infrastructure.
That distinction matters.
16. Copy Trading Can Reduce Human Delay
Manual execution introduces human latency.
You must:
- Read the signal
- Understand it
- Calculate the volume
- Open the platform
- Enter the numbers
- Submit the order
Copy trading automates much of this process.
FastPip’s Copy Trading section is built around automatically replicating trading activity rather than requiring users to manually execute every signal.
Internal Link
This can reduce differences caused by:
- Slow reactions
- Typing errors
- Missed notifications
- Incorrect lot sizes
But it cannot guarantee identical performance.
Why Copy Trading Still Cannot Guarantee Identical Results
Even automated copying can experience:
- Network latency
- Broker differences
- Spread differences
- Slippage
- Liquidity constraints
- Symbol differences
- Account-size differences
- Position-size rounding
Therefore:
Automated copying can reduce performance divergence.
It cannot completely eliminate it.
17. User Behavior Can Change the Result
Execution differences are not always technical.
Sometimes the user changes the trade.
Examples include:
- Entering late
- Exiting early
- Moving the Stop Loss
- Increasing the target
- Closing partial positions differently
- Skipping certain signals
- Doubling position size after a loss
- Taking only signals that “feel right”
At that point, the user is no longer following the original strategy exactly.
Example: Early Exit
Provider:
Entry: 3400
Target: 3430
The market reaches:
3412
The user becomes nervous and closes.
Profit:
+12
The provider continues holding.
Market reaches:
3430
Provider profit:
+30
Later the user compares results and sees that the provider earned much more.
But this difference was not caused by the signal.
It was caused by execution behavior.
18. Selective Signal Taking Can Distort Performance
Another common problem is selectively choosing signals.
Suppose a strategy publishes ten trades.
You skip three.
Unfortunately, those three are winners.
You execute the remaining seven, including several losers.
The provider’s performance and your performance can now look completely different.
A strategy’s historical statistics usually assume that the complete ruleset or complete sequence of valid trades was followed.
Selectively participating changes the sample.
19. Why Scalping Signals Show the Biggest Performance Differences
Scalping is particularly sensitive to execution.
Typical characteristics include:
- Tight targets
- Tight Stop Losses
- High trade frequency
- Short holding periods
- Greater transaction-cost sensitivity
Suppose a scalping strategy seeks only:
5 pips
A two-pip execution disadvantage consumes:
40% of the potential gross move
That can fundamentally alter the strategy’s expectancy.
FastPip’s Trading Types guide similarly highlights transaction costs, leverage, execution speed, and slippage as important risks in scalping.
20. Stop Loss Execution May Also Differ
A Stop Loss is a risk-management instruction.
But the stop price is not necessarily the final fill price during fast-moving markets.
Investor.gov explains that once triggered, a stop order can become a market order and the eventual execution price may differ materially from the stop level when available liquidity changes rapidly.
This means:
Provider Stop Loss:
1.1000
Provider fill:
1.0999
Your Stop Loss:
1.1000
Your fill:
1.0994
Both accounts followed the same Stop Loss instruction.
The realized loss was different.
21. Different Symbol Specifications Can Matter
Even similarly named instruments may have different contract specifications between brokers.
Potential differences include:
- Contract size
- Tick size
- Tick value
- Margin requirement
- Trading hours
- Swap
- Minimum lot
- Maximum lot
- Stop-level restrictions
This is particularly relevant for:
- Gold
- Oil
- Indices
- CFDs
- Cryptocurrencies
Always verify the specification of the instrument you are actually trading.
22. Market Liquidity Affects Signal Replication
Liquidity refers to the availability of buyers and sellers around the current price.
High liquidity generally improves the ability to execute orders near expected prices.
Low liquidity may increase:
- Slippage
- Spread
- Gaps
- Partial fills
- Price jumps
This is one reason the same signal may behave differently during normal London or New York trading compared with thin overnight conditions or major news events.
23. How to Make Your Trading Signal Results Closer to the Provider
Completely identical results may be unrealistic.
But the difference can often be reduced.
Use Similar Broker Conditions
If the provider clearly discloses the broker or execution environment, compare:
- Spread
- Commission
- Execution
- Symbol specifications
You do not necessarily need to choose a broker merely because a signal provider uses it, but you should understand execution differences.
Use a Similar Account Type
If the strategy is tested on Raw Spread conditions, using a high-spread Standard account may materially change results.
Try to compare total trading costs.
Follow the Same Risk Model
Do not blindly copy the provider’s lot size.
Replicate the risk logic instead.
If the strategy uses 1% risk, use an appropriate position size for your own account.
Avoid Chasing Late Entries
If price has already moved significantly away from the original entry, the original risk-to-reward may no longer exist.
Skipping an expired opportunity can be better than executing a materially different trade.
Consider Automated Execution
Copy trading or other automated systems can reduce:
- Human delay
- Manual errors
- Missed trades
FastPip provides both signal and copy-trading resources for traders evaluating these different approaches.
Internal Link
Improve Connection Stability
For latency-sensitive strategies:
- Use stable internet
- Keep the trading platform operational
- Consider VPS infrastructure where appropriate
Do Not Modify Trades Emotionally
If you choose to follow a provider’s strategy, repeatedly changing:
- Stop Losses
- Targets
- Position sizes
- Exit timing
makes performance comparison unreliable.
24. Track Your Own Execution Data
One of the best ways to identify why your results differ is to maintain a trading journal.
Record:
- Provider’s published entry
- Your actual entry
- Provider’s exit
- Your actual exit
- Provider’s Stop Loss
- Your fill at Stop Loss
- Spread
- Slippage
- Commission
- Execution delay
- Position size
- Reason for any manual changes
FastPip’s Trading Journal guide explains how systematically recording trades helps identify execution and behavioral patterns over time.
FastPip – Trading Journal Writing
Internal Link
After 50 or 100 trades, patterns may become clear.
You may discover that the main problem is not signal accuracy.
It may be:
- Late entry
- High spread
- Manual intervention
- Position-size inconsistency
- Poor broker execution
25. How to Measure Signal Execution Difference
You can calculate a simple entry difference.
Suppose:
Provider Entry = 1.1000
Your Entry = 1.1005
Execution Difference:
5 pips
Track this over many trades.
For example:
Average Entry Difference: 1.8 pips
Average Exit Difference: 1.2 pips
Average Total Execution Cost Difference: 3.0 pips
If the strategy’s average trade earns only six pips, this is a serious problem.
If the strategy’s average winner is 150 pips, it may be far less important.
This is why execution quality must be interpreted relative to the strategy.
26. Do Not Judge a Signal Service From One Different Trade
One trade proves very little.
Your broker may experience unusual slippage.
The provider may receive an unusually good fill.
Market volatility may temporarily spike.
Instead, evaluate:
- Dozens of trades
- Average execution difference
- Net returns
- Drawdown
- Risk consistency
- Long-term correlation with provider performance
The key question is whether your results follow the same general performance pattern, not whether every individual trade matches perfectly.
Professional Checklist for Comparing Trading Signal Results
Before concluding that a signal provider’s results are impossible to replicate, check the following.
1. Entry Price
Did you enter near the provider’s published price?
2. Entry Delay
How much time passed before execution?
3. Spread
Is your broker’s spread materially higher?
4. Commission
Are your total transaction costs higher?
5. Slippage
Are your orders repeatedly filled at worse prices?
6. Broker
Are you trading from a substantially different price feed?
7. Account Type
Standard, ECN and Raw Spread conditions may differ.
8. Position Size
Are you following the same percentage-risk framework?
9. Leverage and Margin
Can your account support the same strategy safely?
10. Manual Changes
Did you change the Stop Loss, target or exit?
11. Missed Signals
Are you following the complete sequence?
12. Internet and Infrastructure
Are connection problems causing delays?
13. Strategy Type
Is the signal highly sensitive to execution, such as scalping?
14. Market Conditions
Did volatility or news affect execution?
15. Net Performance
Are you comparing results after all costs?
This checklist usually provides a much better explanation than comparing only the final profit number.
Conclusion: A Good Signal Still Needs Good Execution
Different trading signal results do not automatically mean one account is fraudulent or one user followed the wrong direction.
A signal is only the beginning of the process.
Final performance is created by the combination of:
Signal Quality + Execution + Trading Costs + Risk Management + User Behavior
The provider may receive a different entry.
Your broker may have a wider spread.
You may experience slippage.
Your commission may be higher.
Your account may use different leverage.
Your position size may not follow the same risk model.
You may enter several seconds late.
You may exit early.
Any of these differences can change the final result.
This is particularly important for short-term signals where even small execution differences can represent a large percentage of the expected profit.
The goal should therefore not be to expect every trade on two separate accounts to be perfectly identical.
A more realistic objective is to create sufficiently similar execution conditions so that long-term trading signal results follow a similar pattern.
To reduce the difference:
- Understand the provider’s execution environment
- Compare total trading costs
- Use appropriate account conditions
- Follow the same risk model
- Reduce unnecessary execution delays
- Avoid emotional trade modifications
- Track your actual fills
- Evaluate performance over a meaningful sample
Investor.gov’s execution guidance reinforces the underlying point: submitting the same type of order does not guarantee an identical execution price, particularly when markets move quickly.
Trading signals identify opportunities.
Execution determines how much of that opportunity reaches your account.
Frequently Asked Questions
Why are my trading signal results different from the provider?
Differences can come from slippage, spread, broker pricing, execution speed, commission, account type, leverage, position sizing, entry delay and manual trade management.
Does receiving the same signal guarantee the same profit?
No. A signal provides the same trading idea, but execution conditions can produce different results.
What is slippage in signal trading?
Slippage is the difference between the expected execution price and the price at which the order is actually filled.
Can broker spread make a profitable signal unprofitable?
Yes, especially in short-term strategies where the expected profit is small relative to transaction costs.
Why do scalping signals produce more different results?
Scalping uses small targets and short holding periods, making spread, commission, latency and slippage a larger proportion of expected profit.
Does using the same broker guarantee identical trading signal results?
No. It can reduce some differences, but account type, latency, liquidity, order timing and position sizing can still vary.
Can copy trading make results identical?
Copy trading can reduce manual delay and human error, but it cannot completely eliminate broker, liquidity, slippage and execution differences.
Does leverage change the profitability of a signal?
Leverage primarily affects available exposure and margin. Profitability still depends on trade size, market movement and risk management.
Why does position size matter?
Position size determines how much money is gained or lost for a given market movement. Using a different percentage of account risk creates a different performance profile.
Can a VPS improve signal execution?
A VPS can improve connection stability and may reduce latency when located close to relevant trading infrastructure, but it cannot guarantee a particular execution price.
Should I enter a signal if the price has already moved?
Not automatically. If price has moved significantly away from the original entry, the risk-to-reward structure may have changed.
How can I make my results closer to the signal provider?
Use comparable broker and account conditions, follow the same risk framework, reduce execution delay, avoid unnecessary trade modifications, and track your fills over a large sample.
Should I compare individual trades or long-term performance?
Long-term performance is generally more useful. Individual trades can differ because of temporary execution conditions, while a larger sample gives a better picture of whether the strategy is being replicated effectively.